Every now and then there are situations where you need to draw timing diagram. I have drawn those sometimes with different tools, but none of them have been ideal (text description, hand drawings, ASCII art etc..).
So what are the existing solutions worth to check out? There are font-based solutions that let you “type” the timing diagrams. We found Xwave is a TrueType™ font that has electrical waveform gliphs. Timing Diagram Font is another font created for same purpose. Latex users can use tikz-timing, which makes sketching out your timing diagrams as much fun as laying out a very complex table in Latex (that is: not fun at all).
After reading Timing waveforms posting at Hackaday I ended up testing Wavedrom. It looked quite promising for drawing digital circuit timing diagrams. Give the online editor demo a try. You can easily make simple drawings without looking at any manual or tutorial.
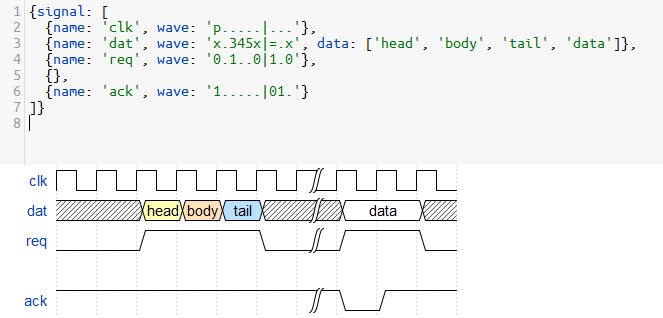
WaveDrom is a JavaScript application. WaveDrom renders the diagrams directly inside the browser using SVG technology. You can start experimenting with Hitchhiker’s Guide to the WaveDrom and online editor. WaveDrom looks like an excellent tool for creating simple waveforms (although has some challenges on file access).
Clearly, some good thought has been put into the waveform description language, WaveJSON; it’s mostly readable and makes the essentials quick and easy. WaveJSON is a format that describes Digital Timing Diagrams with WaveJSON grammar rules.
What if you already have data on some other format that you want to convert to WaveJSON format to use with WaveJSON?
Any way to generate WaveJSON code? discussion offers this example script for converting sampled data into WaveJSON code. It looks super easy, and worked when I tested it. Just put this code inside WaveDrom Editor:
var e, tmp, res ={signal:[]};
for(e in o){
tmp ={wave:”, data:”};
tmp.name = e;
o[e].forEach(function(el, i, arr){
if(i >0&& el === arr[i-1]){
tmp.wave +=‘.’;
}else{
if(el >1){
tmp.wave +=‘=’;
tmp.data += el +‘ ‘;
}else{
tmp.wave += el;
}
}
});
res.signal.push(tmp);
}
return res;
})({
EN:[0,1,1,1,1],
DATA:[0,5,5,5,8]
})
1 Comment
Tomi Engdahl says:
Turn Timing Diagrams Into ASCII Art, For Friendlier Pasting
https://hackaday.com/2022/04/04/turn-timing-diagrams-into-ascii-art-for-friendlier-pasting/
We all use text-based fields at one time or another, and being limited to ASCII only can end up being a limitation. That’s what led [Luke Wren] to create asciiwave, a fantastic tool that turns WaveDrom timing diagrams into ASCII art. Unlike images, ASCII timing diagrams are suitable for pasting into comment fields, change logs, or anywhere else that accepts text only. [Update: As the author kindly shared in the comments below, this tool’s original niche is pasting into HDL (e.g. Verilog) source code comments, where it has a special kind of usefulness.]
WaveDrom itself is a nifty JavaScript tool that we have covered before. It accepts timing diagrams expressed as JSON data, and renders nicely-readable digital timing diagrams as images directly inside one’s browser.
asciiwave: WaveDrom to ASCII art
https://github.com/Wren6991/asciiwave#asciiwave-wavedrom-to-ascii-art