NanoVNA is very tiny handheld Vector Network Analyzer (VNA). A vector network analyzer (VNA) is an instrument that can be used to measure antenna or coax parameters such as SWR, impedance and loss. It can also be used to characterize and tune filters. It is a very useful tool to have if you are building and tuning home made antennas, filters or other RF circuits.
Earlier VNAs have been considered to be be very expensive instruments costing thousands or tens of thousands of dollars so they have only been available on advanced RF laboratories. But now the cost has come down. Nowadays there are cheaper alternatives available. Thank’s to NanoVNA the cost of owning a VNA has now been reduced to only US$50 thanks to the NanoVNA. The open source NanoVNA project by @edy555 and ttrftech has been around since 2016, but only recently have Chinese sellers begun mass producing the unit and selling them
NanoVNA is advertised as a standalone device with LCD display, portable device with battery. It can also controlled with PC software.The frequency range is from 50 kHz to 900 MHz. I had earlier posted some videos on this device to http://www.epanorama.net/newepa/2019/08/11/nanovna-handheld-vector-network-analyzer-vna/
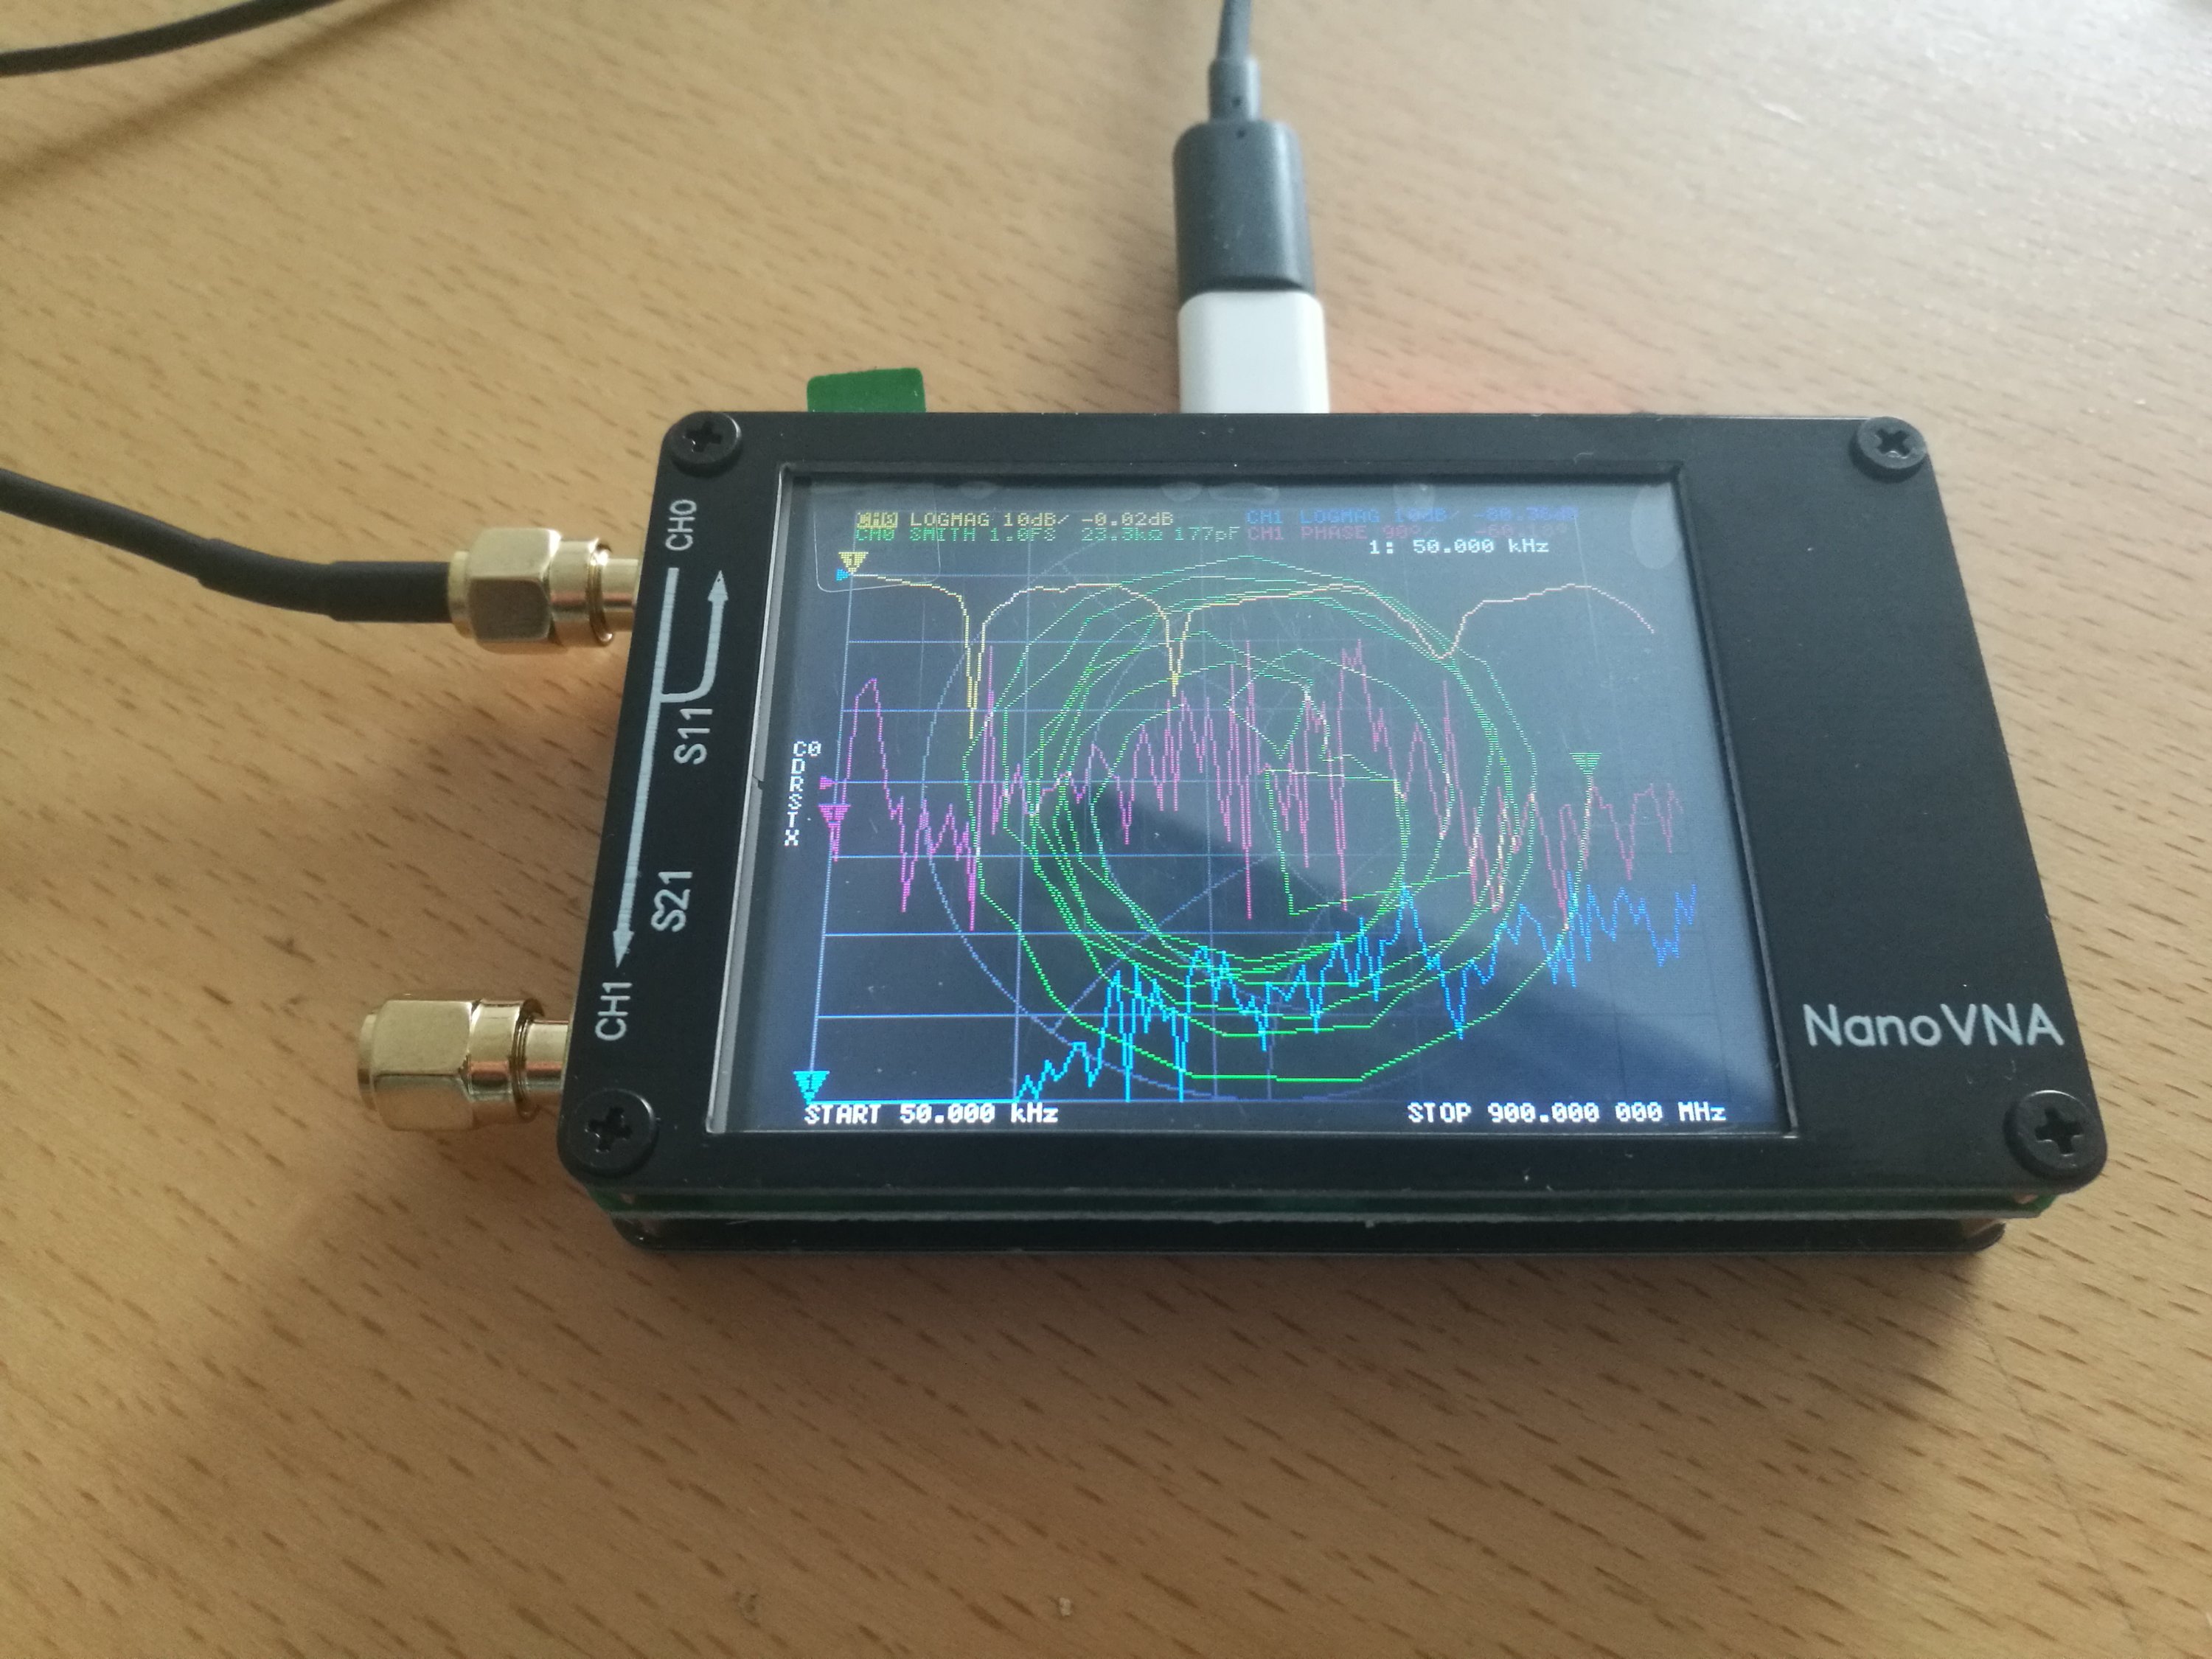
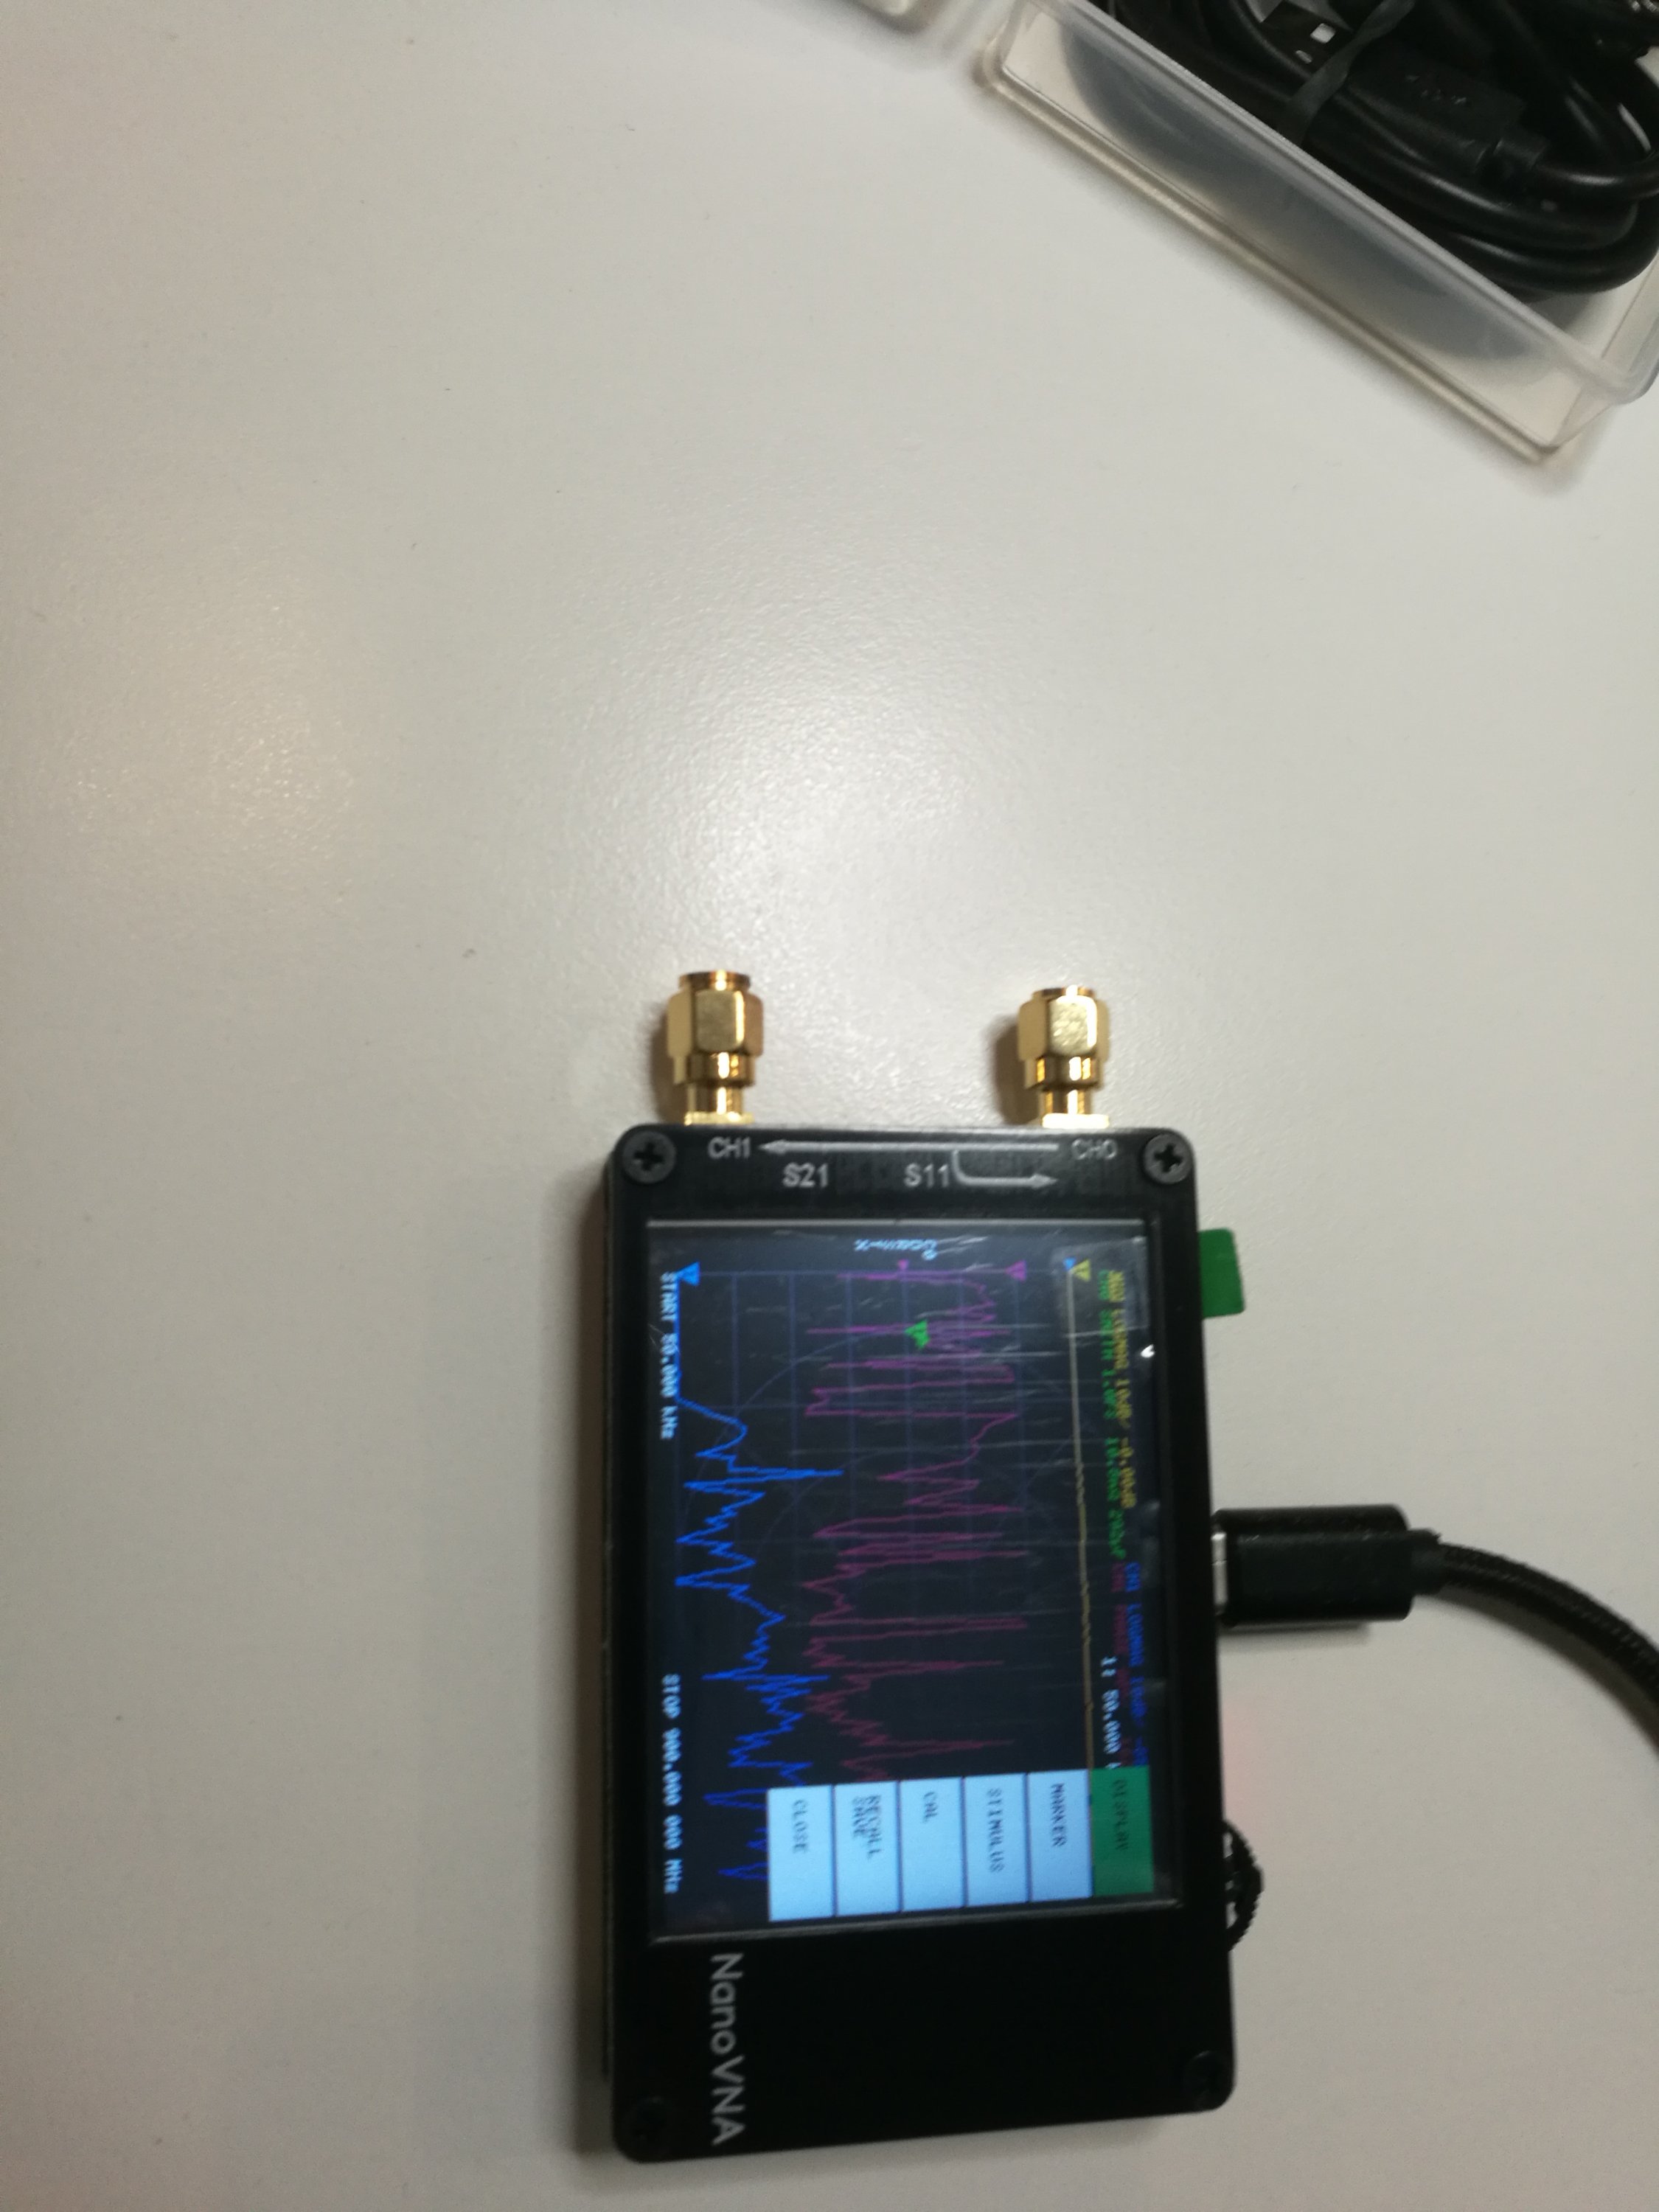
There are a ton of people selling them out of China. I ordered mine from my trusted source Banggood.com that sells one for around $65. Here is the device I received:
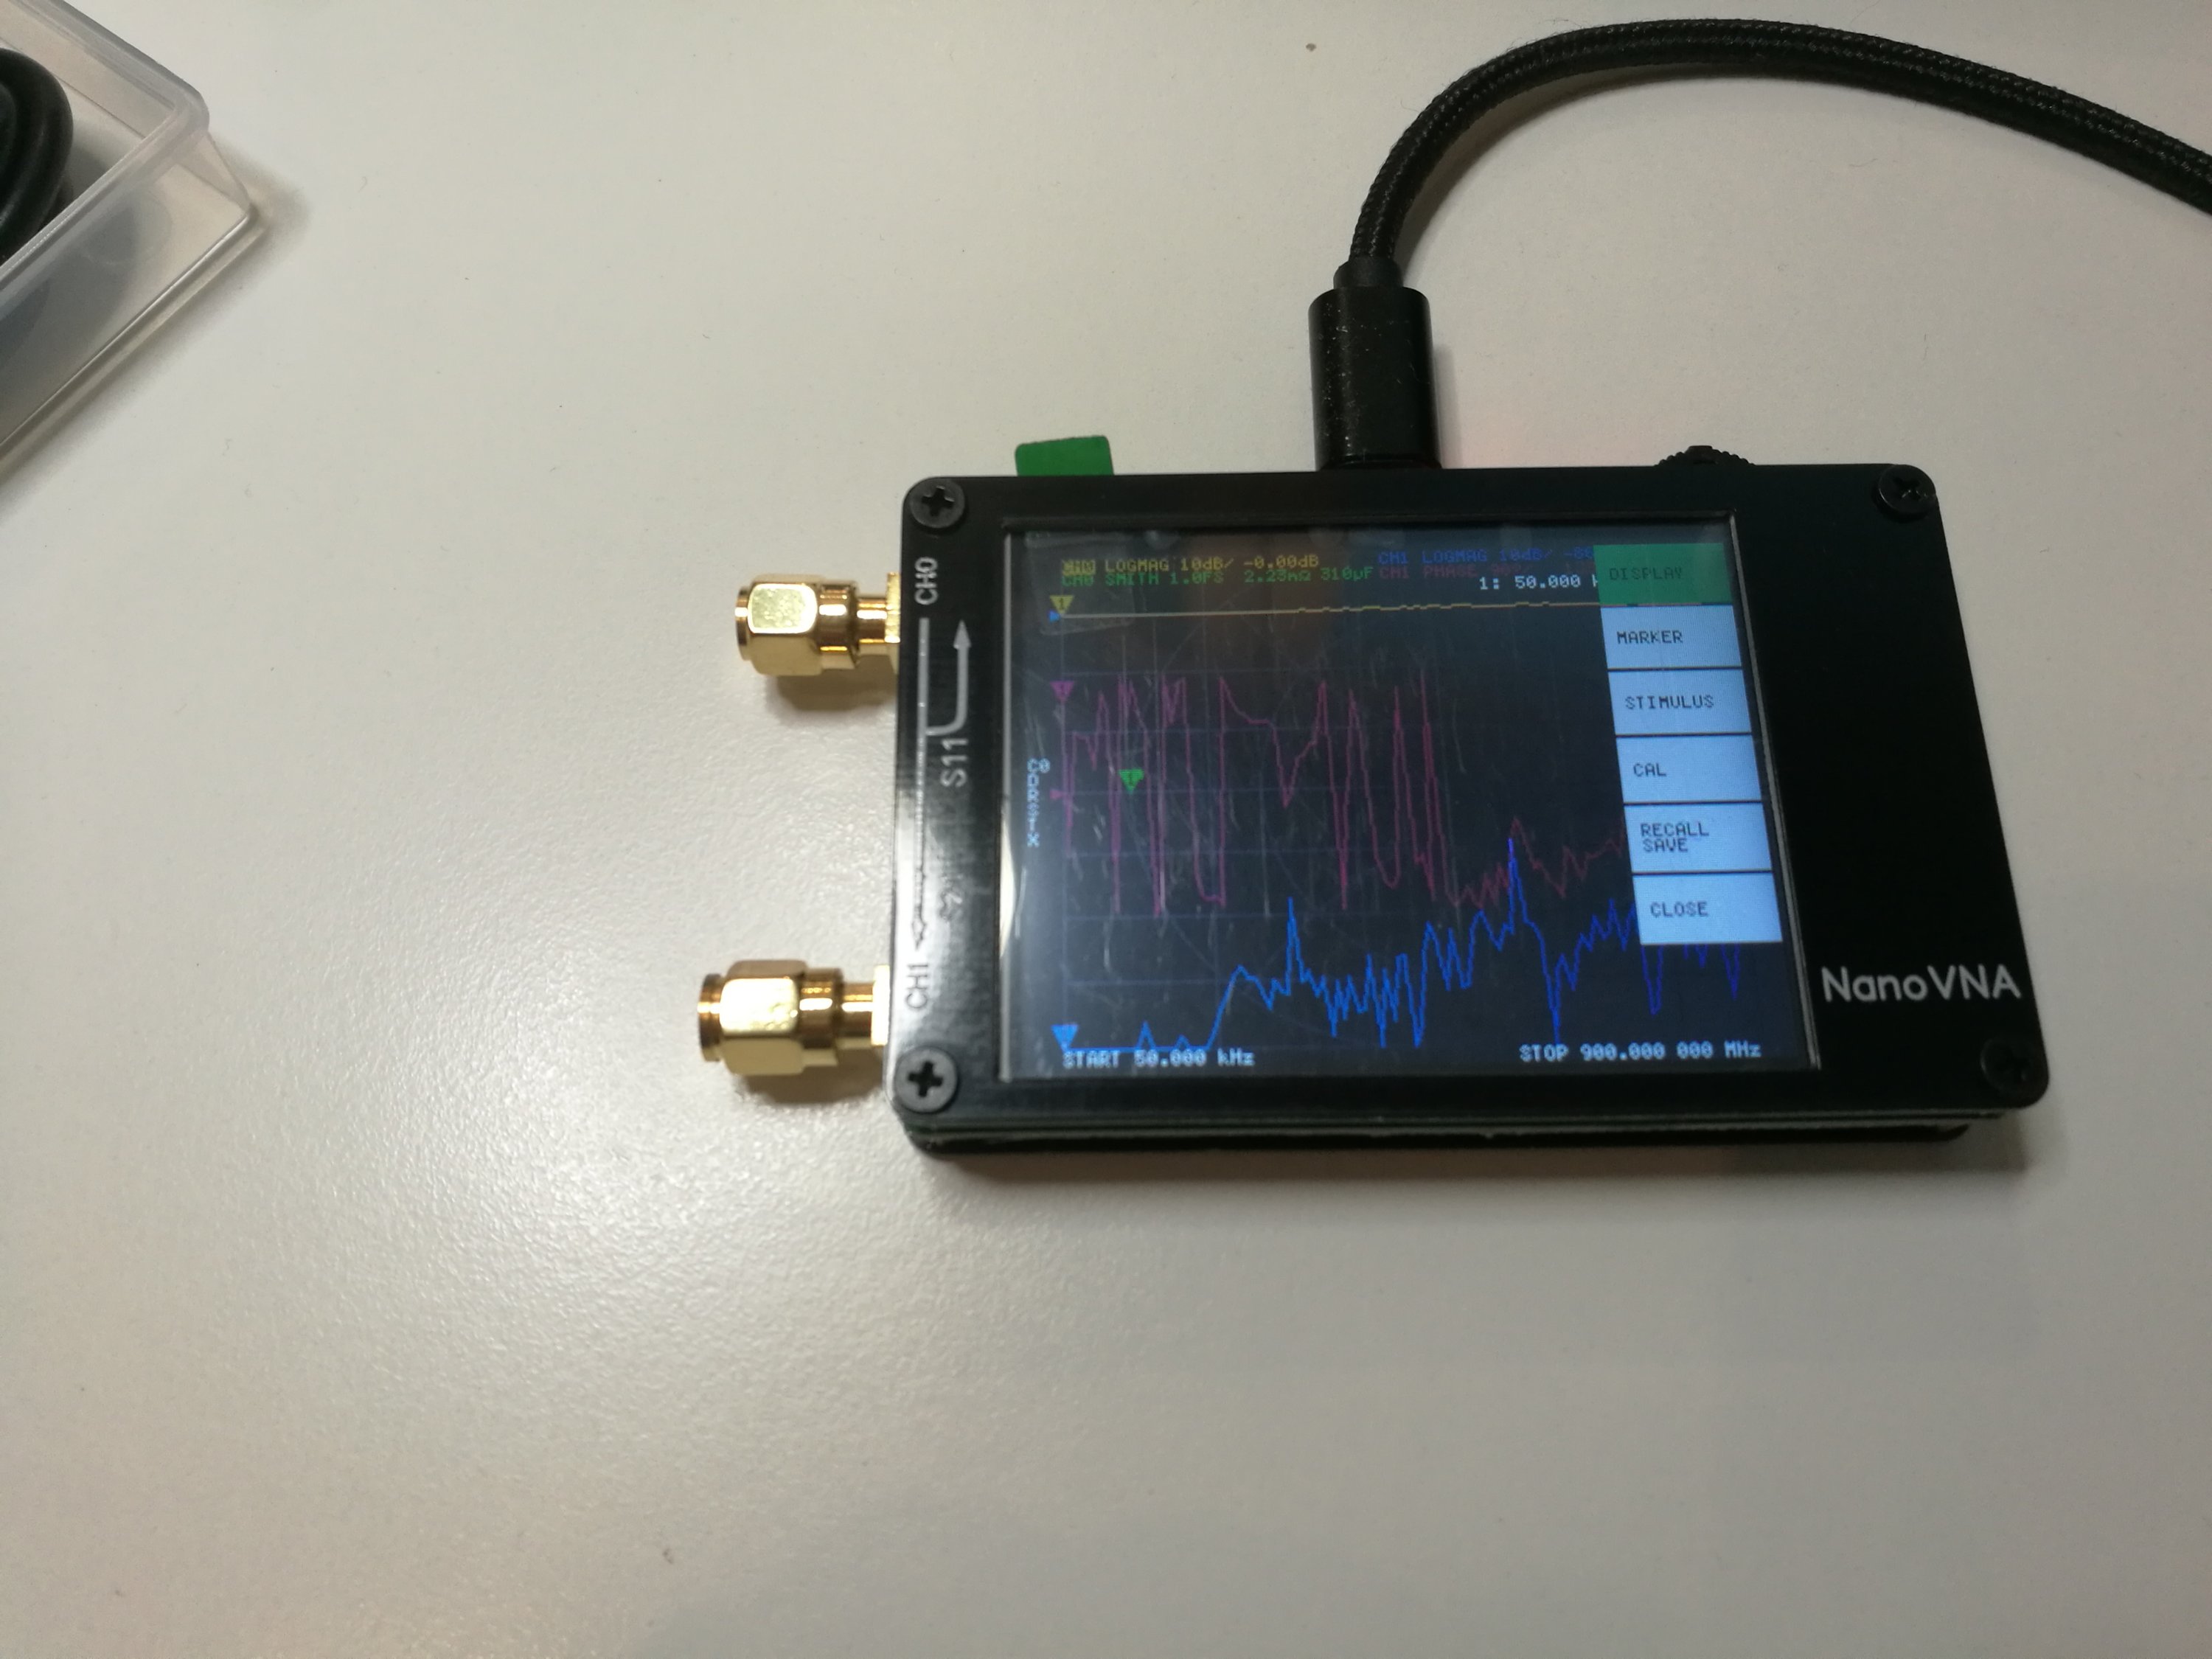
NanoVNA Vector Network Analyzer 50KHz – 900MHz Digital Display Touch Screen Shortwave MF HF VHF UHF Antenna Analyzer Standing Waveis a a DIY product with vector network measurement function. It includes a 2.8-inch touch screen, TX/RX measurement, can determine the complete S11 and S21 parameters (claimed that can be modified to measure S12 and S22). Here is the technical data from product page:
● RF output: -13dbm (maximum -9dbm)
● Measurement range: 70dB (50kHz-300MHz), 60dB (300M-600MHz), 50dB (600M-900MHz) enable extended firmware);
● Port SWR: < 1.1
● Display: 2.8 inch TFT (320 x240)
● USB interface: USB type-C communication mode: CDC (serial)
● Power: USB 5V 120mA, can use battery powered, maximum charging current 0.8A (battery Not included )
● Number of scanning points: 101 (fixed)
The firmware for the device is open source and available at https://github.com/ttrftech/NanoVNA. The device schematics are also available there.
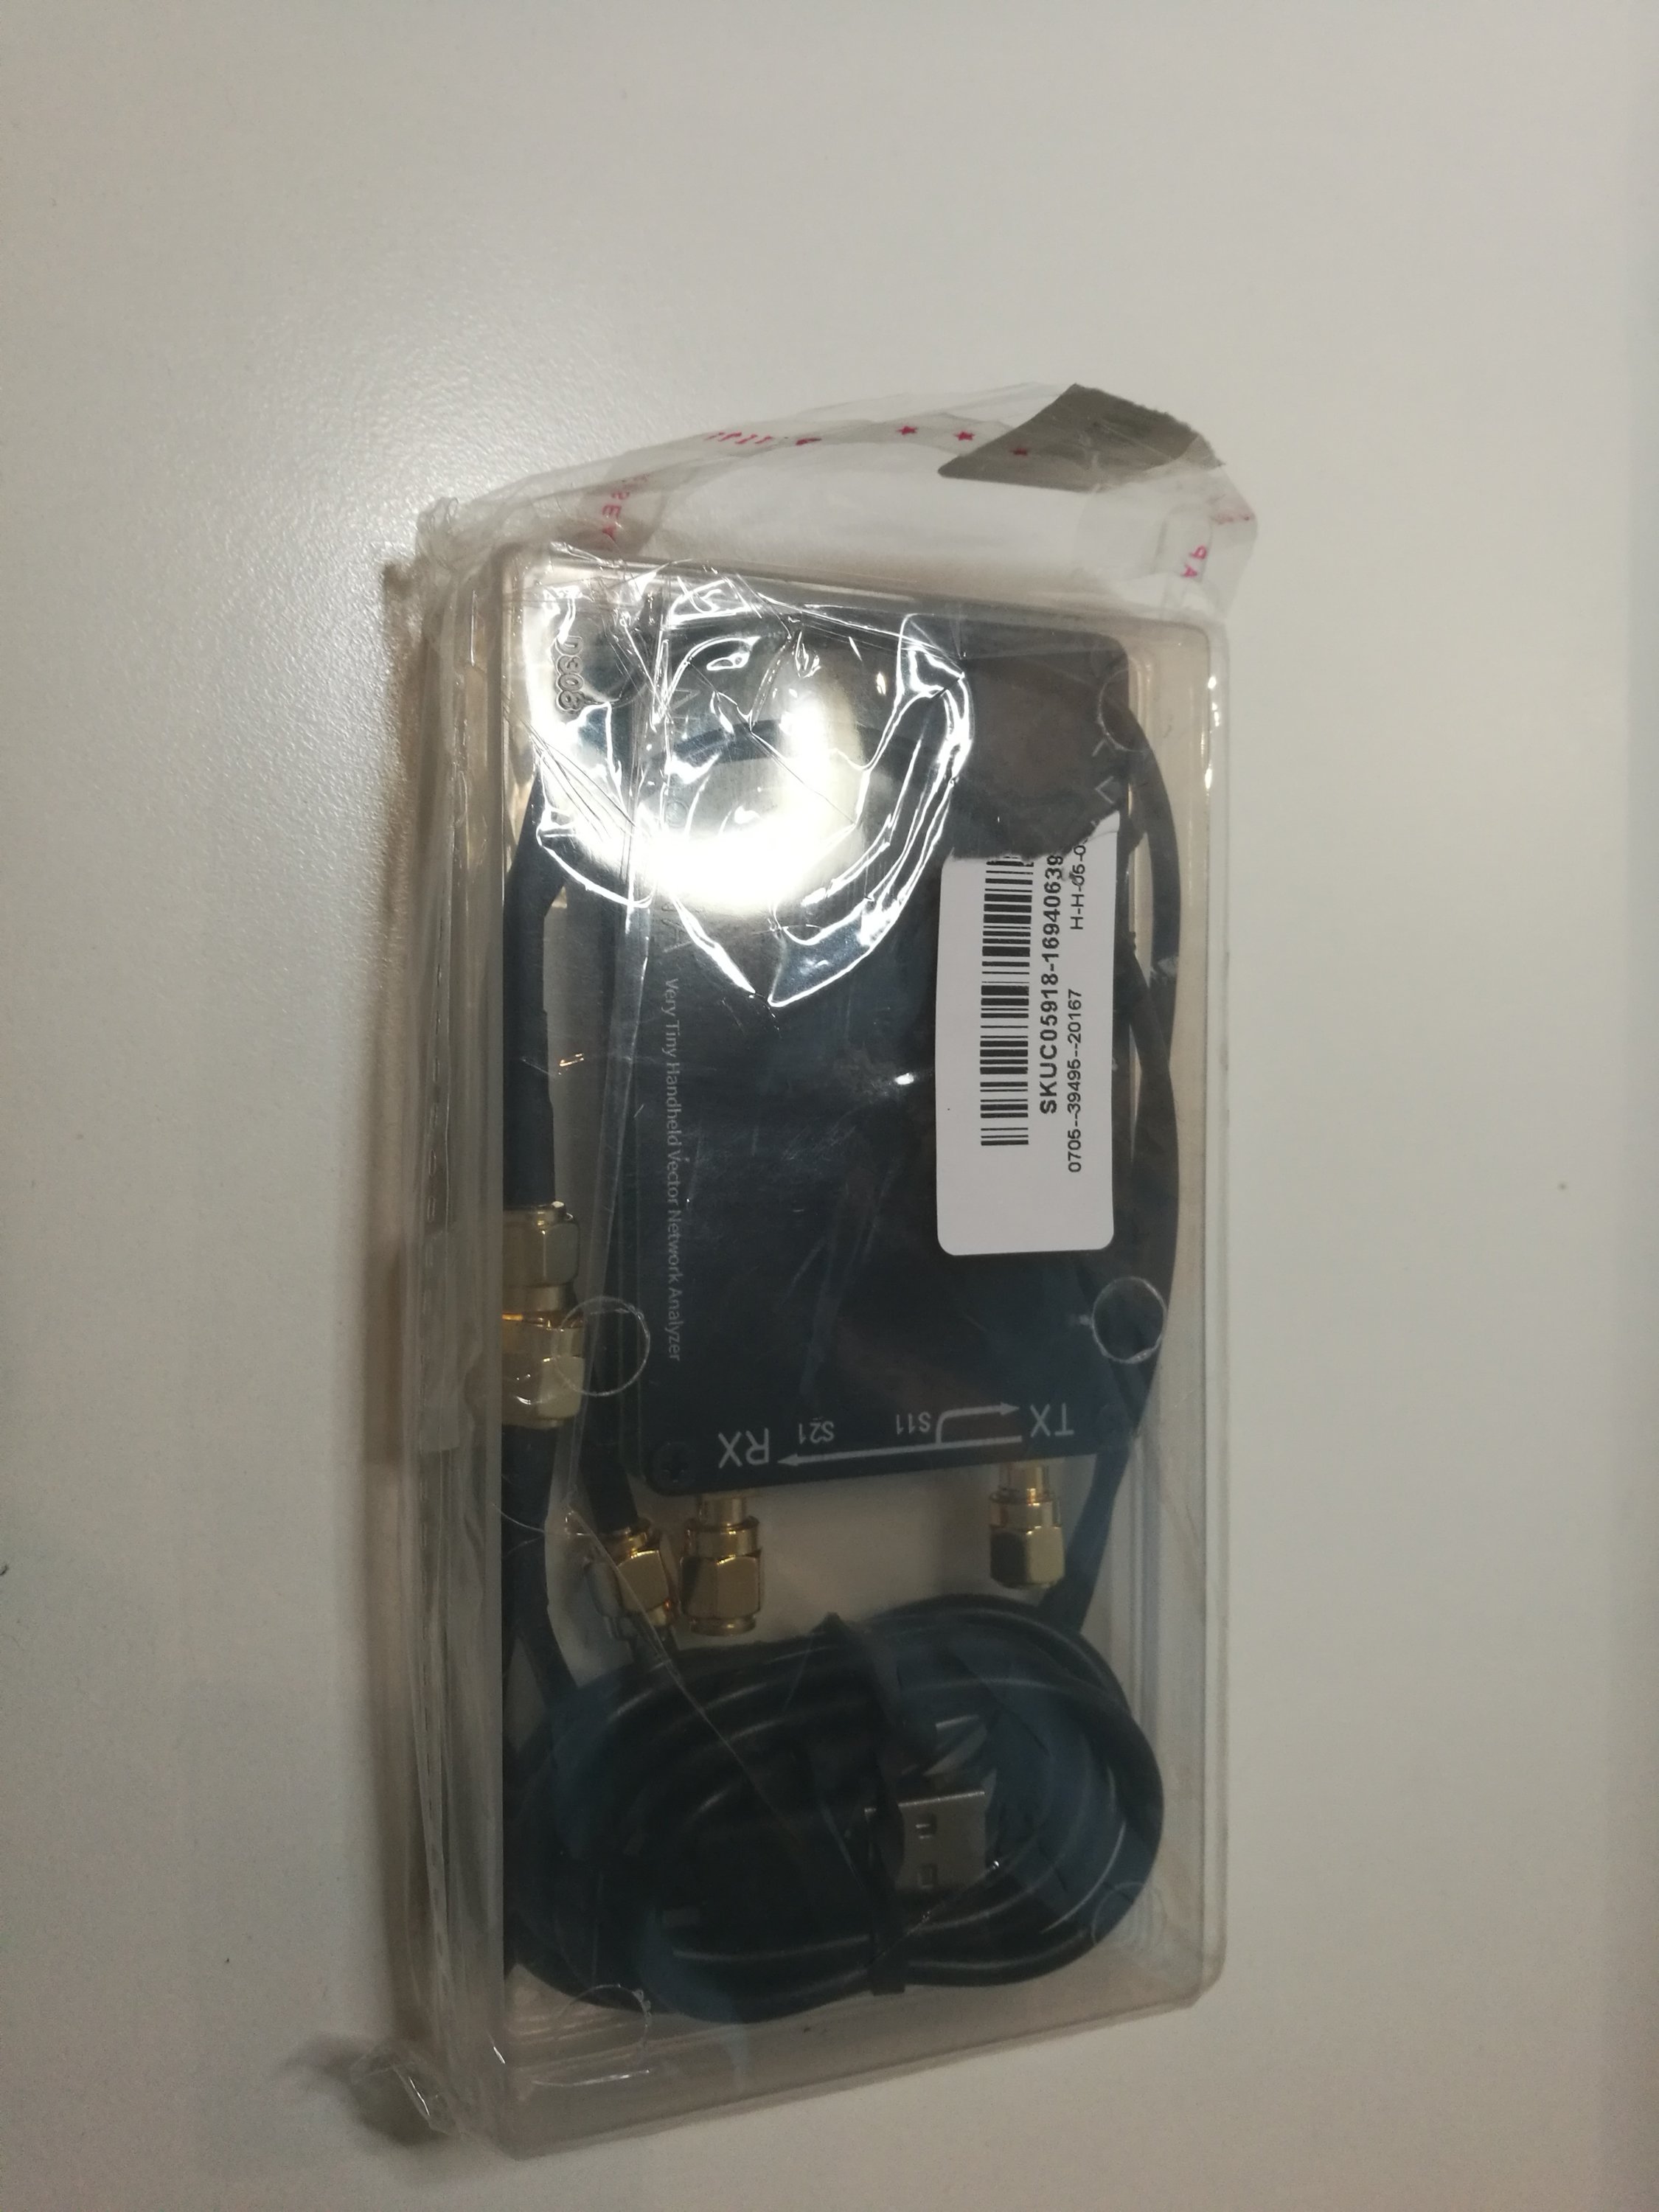
The product package included NanoVNA device, USB Type-C data cable, two 30mm SMA male to male cable and test connectors, one SMA female to female connector and calibration parts (SMA connector with open, short circuit and 50 ohms terminator). Everything came in a nice plastic box that is useful for storing and transporting all the parts.
There is also PC software to work with this device. The device home page had software package that included NanoVNA v1.01 software did not work for me. After some Googling I found a discussion on the problem with this software on some countries (it was . vs , issue on number presentation) and the discussion recommended to download NanoVNA v1.03 from https://drive.google.com/drive/folders/1IZEtx2YdqchaTO8Aa9QbhQ8g_Pr5iNhr. NanoVNA v1.03 worked for me.
There were also some Python software code that I did not try this time.
Other issues:
The device supports rechargeable LiPo batteries, but the batteries are not included on the model I bought because of the safety of international transportation. I also liked to have the LiPo battery installed on my device. The device has battery charging circuitry, so installing suitable LiPo battery should make it very portable instrument (500mAh battery should give offline for 2 hours). Getting suitable LiPo battery and installing it is for another article.
Sometimes I feel that it would be nice if this device has a full case. I saw one 3D printable case for NanoVNA at Thingverse. I have downloaded the files, but I have not yet had access to suitable 3D printer to print it.
Related postings:
http://www.epanorama.net/newepa/2019/08/11/nanovna-handheld-vector-network-analyzer-vna/
https://www.rtl-sdr.com/reviews-of-the-nanovna-an-ultra-low-cost-50-vector-network-analyzer/
http://www.bbrc.info/articles/nanovna
https://groups.io/g/nanovna-users
https://brainwagon.org/2019/09/02/first-test-of-the-nano-vna-on-my-beacon-antenna/
https://github.com/ttrftech/NanoVNA
https://hexandflex.com/2019/08/31/getting-started-with-the-nanovna-part-1/
https://mtmotorstables.blogspot.com/2019/08/reviews-of-nanovna-ultra-low-cost-50.html
Getting the device:
If you are interested in getting one, use this link https://www.banggood.com/NanoVNA-Vector-Network-Analyzer-50KHz-900MHz-Digital-Display-Touch-Screen-Shortwave-MF-HF-VHF-UHF-Antenna-Analyzer-Standing-Wave-p-1471576.html?p=27131452996820140438 to get the version I got. It seems that the same web shop has also a slightly cheaper version (white color) in pre-order at https://www.banggood.com/NanoVNA-Vector-Network-Analyzer-50KHz-900MHz-Digital-LCD-Display-HF-VHF-UHF-Antenna-Analyzer-Standing-Wave-USB-POWER-p-1549963.html?p=27131452996820140438
161 Comments
Tomi Engdahl says:
Another worth to try software
NanoVNASaver
https://github.com/mihtjel/nanovna-saver
A multiplatform tool to save Touchstone files from the NanoVNA, sweep frequency spans in segments to gain more than 101 data points, and generally display and analyze the resulting data.
The software was written in Python on Windows, using Pycharm, and the modules PyQT5, numpy and pyserial.
You can get Windows executable and Python source codes from
https://github.com/mihtjel/nanovna-saver/releases
Tomi Engdahl says:
https://hackaday.com/2019/08/03/antenna-tuning-for-ghz-frequencies/
Tomi Engdahl says:
NanoVNA Is A $50 Vector Network Analyzer
https://hackaday.com/2019/08/11/nanovna-is-a-50-vector-network-analyzer/
Tomi Engdahl says:
https://forums.qrz.com/index.php?threads/new-test-gear-nano-vna.664182/
Tomi Engdahl says:
https://github.com/hendorog/nanovna_test/blob/master/NanoVNA%20test.ipynb
Tomi Engdahl says:
NanoVNA Case
https://www.thingiverse.com/thing:3818979
Tomi Engdahl says:
Calculating Coax Length by using a NanoVNA as a Time-Domain Reflectometer
https://www.rtl-sdr.com/calculating-coax-length-by-using-a-nanovna-as-a-time-domain-reflectometer/
Tomi Engdahl says:
https://zs1sci.com/blog/nanovna-tdr/
https://nuclearrambo.com/wordpress/accurately-measuring-cable-length-with-nanovna/
Tomi Engdahl says:
Getting Started with the NanoVNA -part 1
https://hexandflex.com/2019/08/31/getting-started-with-the-nanovna-part-1/
Tomi Engdahl says:
Getting Started with the NanoVNA -part 2
https://hexandflex.com/2019/09/08/getting-started-with-the-nanovna-part-2/
Getting Started with the NanoVNA -Part 3 – PC Software
https://hexandflex.com/2019/09/15/getting-started-with-the-nanovna-part-3-pc-software/
Tomi Engdahl says:
Michael Ossmann Makes You An RF Design Hero
https://hackaday.com/2016/03/23/michael-ossmann-makes-you-an-rf-design-hero/
Tomi Engdahl says:
Complex Impedances Without The Pain
https://hackaday.com/2019/09/07/complex-impedences-without-the-pain/
https://mightydevices.com/index.php/2019/08/complex-impedance-matching-using-scalar-measurements-math-and-resistors/
Tomi Engdahl says:
My article on battery instalation
http://www.epanorama.net/newepa/2019/09/29/battery-for-nanovna/
Tomi Engdahl says:
https://www.edn.com/electronics-blogs/designcon-central-/4427337/Measure-a-75–cable-with-a-50–VNA
Tomi Engdahl says:
Cheap version on sale:
Original NanoVNA Vector Network Analyzer HF VHF UHF Antenna Analyzer Standing Wave Frequency Range 50KHz -900MHz Touch Screen
https://www.banggood.com/Original-NanoVNA-Vector-Network-Analyzer-HF-VHF-UHF-Antenna-Analyzer-Standing-Wave-Frequency-Range-50KHz-900MHz-Touch-Screen-p-1570540.html?rmmds=flashdeals&p=27131452996820140438
Tomi Engdahl says:
Home
About RTL-SDR
Quick Start Guide
Featured Articles
Software
Signal ID Wiki
Forum
RTL-SDR Store
Guide Book
Contact
October 4, 2019
A NanoVNA 2.0 is in the Works: Same Price, Frequency Range up to 3.5 GHz, Higher Dynamic Range
https://www.rtl-sdr.com/a-nanovna-2-0-is-in-the-works-same-price-frequency-range-up-to-3-5-ghz-higher-dynamic-range/
Tomi Engdahl says:
NanoVNA Tests Antenna Pattern
https://hackaday.com/2020/01/11/nanovna-tests-antenna-pattern/
After building the Yagi, the predicted tuning and impedance matched the real antenna nicely. But what about the radiation pattern? To test that, he used a NanoVNA and a clever test setup.
He needed a test spot out of the antenna’s near field so he set up his workstation 18 feet away from the test antenna which was on a mount that could rotate. On the edge of the workstation table — affixed with painter’s tape — is a NanoVNA connected to a laptop.
Plotting the resulting data with GNUPlot matched up pretty well with the antenna’s predicted performance.
Another aid to consistency was the use of the NanoVNASaver software. This software allows for a frequency sweep along with a display and the creation of Touchstone files.
Test Antenna Signal Pattern on the Cheap
https://imgur.com/gallery/5zWhpTA
Tomi Engdahl says:
NanoVNASaver software
A tool for reading, displaying and saving data from the NanoVNA
https://github.com/mihtjel/nanovna-saver
A multiplatform tool to save Touchstone files from the NanoVNA, sweep frequency spans in segments to gain more than 101 data points, and generally display and analyze the resulting data.
This software connects to a NanoVNA and extracts the data for display on a computer, and for saving to Touchstone files.
Current features:
Reading data from a NanoVNA
Splitting a frequency range into multiple segments to increase resolution (tried up to >10k points)
Averaging data for better results particularly at higher frequencies
Displaying data on multiple chart types, such as Smith, LogMag, Phase and VSWR-charts, for both S11 and S21
Displaying markers, and the impedance, VSWR, Q, equivalent capacitance/inductance etc. at these locations
Displaying customizable frequency bands as reference, for example amateur radio bands
Exporting and importing 1-port and 2-port Touchstone files
TDR function (measurement of cable length) – including impedance display
Filter analysis functions for low-pass, high-pass, band-pass and band-stop filters
Display of both an active and a reference trace
Live updates of data from the NanoVNA, including for multi-segment sweeps
In-application calibration, including compensation for non-ideal calibration standards
Customizable display options, including “dark mode”
Exporting images of plotted values
The software was written in Python on Windows, using Pycharm, and the modules PyQT5, numpy, scipy and pyserial.
You can find the latest binary (.exe) release for Windows at https://github.com/mihtjel/nanovna-saver/releases/latest
Tomaszewski says:
Tektronix VNA TR503 offers dynamic range over 122dB. Whereas it is far too much for most cases the 60, 50 finally 40 dB of NanoVNA -F is, in my opinion, not enough. For is the reason for these low figures ? What an option of NanoVNA would cost should dynamic range of minimum 85dB be offered ?
Tomi Engdahl says:
I don’t know what would cost to provide what you ask for.
I have read that new nanoVNA is on the works with improvements like wider frequency range etc…
Tomi Engdahl says:
There are some limitations of dynamic range of the audio codec used and the mixers etc…
The 60 dB is got on direct operation…
Lower values are when harmonics of clock are used…. much less ideal signal processing chain and lower effective signal levels.
Tomi Engdahl says:
There seems to be a new version with improved specifications coming:
NanoVNA V2
NanoVNA V2 3GHz Vector Network Analyzer
https://www.tindie.com/products/hcxqsgroup/nanovna-v2/?utm_source=hackaday&utm_medium=link&utm_campaign=fromstore
3GHz second generation NanoVNA vector network analyzer, designed in collaboration with OwOComm.
Specifications:
Frequency range: 50kHz – 3GHz
System dynamic range (calibrated): 70dB (up to 1.5GHz), 60dB (up to 3GHz)
S11 noise floor (calibrated): -50dB (up to 1.5GHz), -40dB (up to 3GHz)
Sweep rate: 100 points/s
Display: 2.8”, 320 x 240
USB interface: Micro USB
Power: USB, 300mA
Battery: not included. Includes charging circuitry. User can install a 1000mAh – 2000mAh lithium-ion battery with maximum dimensions 6 x 40 x 60 mm.
Battery connector: JST-XH 2.54mm
Maximum sweep points (on device): 201
Maximum sweep points (USB): 1024
VNA-QT software supported platforms: Linux, Windows (7+), Mac OS planned
User guide: https://github.com/nanovna/NanoVNA-QT/raw/master/ug1101.pdf
Tomi Engdahl says:
NanoVNA-F firmware 0.0.5 released ! up to 1.5GHz, bug fix, REAL IMAG R X trace format
https://deepelec.com/2019/12/30/nanovna-f-0_0_5/
https://github.com/flyoob/NanoVNA-F
Tomi Engdahl says:
NanoVNA-F, NanoVNA-Fairy, FreeRTOS version of TTRFTECH’s NanoVNA
https://github.com/flyoob/NanoVNA-F
Tomi Engdahl says:
Shoot The Moon With This Homebrew Hardline RF Divider
https://hackaday.com/2020/03/31/shoot-the-moon-with-this-homebrew-hardline-rf-divider/
[Derek]’s hardline build comes in. The divider acts as an impedance transformer and matches two 50-ohm antennas in parallel with the 50-ohm load expected by the transceiver. He built his from extruded aluminum tubing as the outer shield, with a center conductor of brass tubing and air dielectric. He walks through all the calculations; stock size tubing was good enough to get into the ballpark for the correct impedance over a quarter-wavelength section of hardline at the desired 432-MHz, which is in the middle of the 70-cm amateur band. Sadly, though, a scan of the finished product with a NanoVNA revealed that the divider is resonant much further up the band, for reasons unknown.
Tomi Engdahl says:
NanoVNA V2
NanoVNA V2 3GHz Vector Network Analyzer
https://www.tindie.com/products/hcxqsgroup/nanovna-v2/?utm_source=hackaday&utm_medium=link&utm_campaign=fromstore
Tomi Engdahl says:
Make sense of antenna design and matching networks
https://www.edn.com/make-sense-of-antenna-design-and-matching-networks/?utm_source=newsletter&utm_campaign=link&utm_medium=EDNConsumerElectronics-20200408
When it comes to actual antennas in the real world, much of our knowledge is empirical. We know very broadly theories that explain how a point charge radiates (Maxwell’s equations), the need for matching (microwave theory), and how dipole antennas drawn on paper radiate the way they do, but these laws are nearly useless in solving the real-world problem of antenna design. By sharing my intuition on how wireless electronics work on a physical level, I hope to be useful in shaping a broad understanding of antenna design and matching networks and underscore the value of best practices and hard-earned wisdom.
The gradual opening of a horn antenna is basically an energy transformer that takes a guided wave with a 50 Ω impedance from a coaxial cable and transforms it into a free space wave with 377 Ω wave impedance.
Without using any mathematical formulas, we just stated something relevant and obvious about antennas: they are matching elements that match the guided wave to the free-space wave. Why does this matching matter? Because, like the electrical transformer case, a guided wave requires this energy transformation to be able to traverse the free space with minimum losses. (If an electromagnetic wave has a wave impedance that’s off from the free space impedance, it simply won’t propagate in free space.)
when I say that the wave impedance of free space is 377 Ω it means that, for a wave to traverse the free space, it needs to have its wave impedance to be 377 Ω. We know this number because we can solve Maxwell’s equations in free space and find out that the wave impedance is 377 Ω. Alternatively, we can conduct experiments to measure the ratio of electrical to magnetic energy in a free space wave, and get the same number to an incredible degree of accuracy.
What about the 50 Ω we use for the wave impedance inside the waveguide? Historically, 50 Ω is a standard number used for microwave circuits (although some of them are 75 Ω and even higher). Yet in modern microwave technology, aka on-chip microwave circuits, nobody cares about this 50 Ω figure anymore.
For an antenna to be as efficient as possible, it needs to resonate around the frequency of the wave that it is transmitting. Resonance causes the electromagnetic energy to keep oscillating between the ends of the antenna structure, thus, keeping as much energy as possible on the structure instead of reflecting it back to the source. This retention enables more radiation power. Resonance, however, requires the antenna dimension to be equivalent to half the wavelength of the propagating wave. Essentially, then, a useful antenna for this direct application would have a length in the order of magnitude of the wavelength of the propagating wave.
To use a smaller antenna, we need a higher signal frequency, and that’s what we do when we apply modulation to the signal.
With Bluetooth, this carrier has a frequency of 2.4 GHz, which reduces the antenna dimension to ~2 cm. This is one of the reasons we don’t see antennas anymore. They are small enough to hide inside our electronics.
The 2.4-GHz signal that we have was prepared on-chip, which means that it is a low-power signal. Now it is time to convert this low-power signal to high power, which we do by using a power amplifier (PA).
Matching network
Now that we have discussed the antenna’s surroundings, let’s take a closer look at the matching network. This can be slightly confusing. Why do we need matching again? Matching is essentially energy transformation. When we create a high-energy wave with a PA, it has a certain wave impedance. But the standard antenna (and all the connectors and traces from the chip to the antenna) have a wave impedance of 50 Ω. So now for efficient energy propagation, we need to make sure that the wave exiting the PA is converted to 50 Ω. We do this by using a matching network.
Tomi Engdahl says:
So. You Bought A VNA. Now What?
https://hackaday.com/2020/04/23/so-you-bought-a-vna-now-what/
The NanoVNA originated a few years ago from [edy555], and has since been cloned in huge numbers by Chinese manufacturers. It’s a surprisingly simple piece of hardware, with an Si5351 clock generator providing the phase-synchronous oscillators, a brace of three balanced mixers providing the RF-to-baseband downconversion, an I2S codec digitizing the measurements, and an STM32F07 ARM Cortex M0 microcontroller doing all the math and running the show.
If a VNA is that simple, you might be asking why commercial ones are so expensive then, but the answer lies in the rather limited capabilities of the NanoVNA. It has a fundamental frequency range of 300 MHz, it uses an audio ADC, and its RF components are not of a particularly high spec. Compared with a commercial model that will have a frequency range in the GHz, a much higher specification ADC, a much lower noise figure, and a hugely more capable computing system to drive it, it becomes rapidly obvious where the extra cash goes before you have even considered matters such as calibration.
The NanoVNA is a real VNA and it’s very useful for radio amateurs and hobbyists, but it’s still something of a toy in the scheme of VNAs. So having discovered what the NanoVNA is, how do we use it? This isn’t a review of the device, instead it’s a write-up of my experiences with it as a first-time user.
The NanoVNA is controlled by a little jog switch and a not-very-responsive touch screen, so there is a bit of a learning curve in getting to know its interface.
Once you have calibrated it and understood the interface, it becomes a very straightforward instrument to use. I also picked up an “RF Demo kit”, a PCB with a set of test RF networks, filters, and attenuators.
The VNA was living up to its reputation as the Holy Grail of RF test equipment, and even after only a few days of owning one I can’t quite see how I ever managed without it.
Tomi Engdahl says:
Determining Resonator Q Factor from Return-Loss Measurement Alone
Engineers often want to measure the Q factor of a resonator. But did you know you could affordably and accurately determine that Q factor from a return-loss measurement?
https://www.mwrf.com/technologies/test-measurement/article/21132616/determining-resonator-q-factor-from-returnloss-measurement-alone?utm_source=RF+MWRF+Today&utm_medium=email&utm_campaign=CPS200528032&o_eid=7211D2691390C9R&rdx.ident%5Bpull%5D=omeda%7C7211D2691390C9R&oly_enc_id=7211D2691390C9R
Tomi Engdahl says:
https://www.edn.com/make-sense-of-antenna-design-and-matching-networks/
Tomi Engdahl says:
Determining Resonator Q Factor from Return-Loss Measurement Alone
Engineers often want to measure the Q factor of a resonator. But did you know you could affordably and accurately determine that Q factor from a return-loss measurement?
https://www.electronicdesign.com/technologies/test-measurement/article/21132622/determining-resonator-q-factor-from-returnloss-measurement-alone?utm_source=EG+ED+Analog+%26+Power+Source&utm_medium=email&utm_campaign=CPS200619060&o_eid=7211D2691390C9R&rdx.ident%5Bpull%5D=omeda%7C7211D2691390C9R&oly_enc_id=7211D2691390C9R
It’s not uncommon to want to measure the Q factor of a resonator. One may need to determine its suitability for use in a coupled resonator filter or evaluate the performance of an RFID tag. Generally, this measurement is made with very light input and output coupling to reduce the loading effect of the 50-Ω source and load impedances.
After measuring an S21 S-parameter in this fashion, the data is analyzed to extract the resonant frequency and Q factor of the resonator. The peak of the response is taken to be the resonant frequency, and then two markers are placed 3 dB down from the peak value. The peak frequency divided by the 3-dB width of the peak is then equal to the Q factor.
with a relatively simple calculation, one can determine the Q factor of a resonator from the return-loss measurement alone.
Tomi Engdahl says:
About NanoVNA V2
https://nanorfe.com/nanovna-v2.html
NanoVNA V2 is a low cost 3GHz T/R vector network analyzer developed by HCXQS in collaboration with OwOComm. The V2 hardware is a new from-scratch design and is not based on the original NanoVNA by edy555. Compared to the original NanoVNA, V2 does not use harmonics for measurements and achieves higher dynamic range.
Buying
HCXQS and NanoRFE are official manufacturers of the S-A-A-2 (NanoVNA V2), and are the only manufacturers that fund the development team.
As of July 2020 most Aliexpress sellers are selling clones, many of which perform badly.
Tomi Engdahl says:
QRP-Labs Filter Adapter for NanoVNA
Lex Bolkesteijn’s filter adapter was made using some spare parts and lowpass and bandpass filter kits.
https://www.hackster.io/news/qrp-labs-filter-adapter-for-nanovna-7ed8ca1ff4a4
Tomi Engdahl says:
Transmission Line S-parameters: A Summary and Causality
https://www.nwengineeringllc.com/article/transmission-line-s-parameters-a-summary-and-causality.php
Once you have the transmission line S-parameters, you can calculate a transfer function. This can be used to tell you how any signal will behave once it enters the transmission line and interacts with the load or source. The transfer function for the network can be calculated by converting the transmission line S-parameters to ABCD parameters
Summary
In summary, we took the transmission line S-parameters and used them to calculate the signal behavior for an asymmetric transmission line. The general procedure can be summarized as follows:
Select your input signal X(t)
Calculate the Fourier transform of the input truncated at t = 0.
Calculate the convolution in the frequency domain between the transfer function and FT[X(t)]
The resulting time-domain waveform shows you the signal reaching the load, which can be calculated as a function of the transmission line length. This tells you the signal seen at the receiver for any input signal X(t).
Tomi Engdahl says:
https://nanovna.com/
NanoVNA is very tiny handheld Vector Network Analyzer (VNA),designed by edy555, it is a very portable but high-performance vector network analyzer. It is standalone with lcd display, portable device with battery.
Edy555 put his software at https://github.com/ttrftech/NanoVNA
At first, NanoVNA was designed to work at 50kHz-300MHz. NanoVNA’s mixer SA612A needs 5V power supply to work properly. The battery can’t be driven directly. The original version of NanoVNA needs external USB power supply to work properly.Hugen recreated the NanoVNA based on the schematic of the edy555 and added a DC-DC circuit to allow the NanoVNA to work independently. Hugen tried to extend the measurement frequency using harmonics, allowing the NanoVNA to measure frequencies up to 900MHz.
You can make or purchase a finished NanoVNA at a low cost. NanoVNA is now the most active vector network analyzer and antenna analyzer project in the community. Usually buying a finished NanoVNA-H is the most convenient way to get NanoVNA.
Edy555 is updating his software, harmonic extensions have been added, usually a well-made NanoVNA can be acquired better than 40dB dynamics at 900MHz . After community discussions, the improved NanoVNA-H rev3.4 and NanoVNA-H 4 can still have 40dB dynamics up to 1.5GHz. Thanks to the excellent performance of the improved NanoVNA-H Rev3.4, edy555 has increased the frequency limit of his 0.7.0 firmware to 2.7GHz, but users should be aware of the uncertainty measured above 1.5GHz.
Cho45 adds TDR (Time Domain Reflectometer) functionality to the NanoVNA. Time domain measurements are widely required by the community to quickly measure the length of the coaxial cable and determine the cable fault point by calculating the discontinuous impedance.
Tomi Engdahl says:
how to use TDR in the firmware of the nanovna?
https://groups.io/g/nanovna-users/topic/34295118
Hiroh Satoh’s (user “ch045″) has written an informal user guide for the NanoVNA in Japanese. Attached is the Google translation of the “Time Domain Operations” section. For cable measurements, enable TDR by using low-pass mode in the time domain.
AUGUST 26, 2019
CALCULATING COAX LENGTH BY USING A NANOVNA AS A TIME-DOMAIN REFLECTOMETER
https://www.rtl-sdr.com/calculating-coax-length-by-using-a-nanovna-as-a-time-domain-reflectometer/
The NanoVNA comes with preinstalled software for it’s LCD GUI, as well as a Windows program. However, the software is currently basic and doesn’t implement everything possible with a VNA. Over on his blog, nuclearrambo has put up a post showing how to use the NanoVNA as a Time-domain reflectometer (TDR). A TDR allows you to measure coax cable length, and that can be useful for finding exactly where a suspected cable or connector fault is.
Nucclearrambo provides a Python script which can be used with the NanoVNA’s S1P output data to create a TDR graph. His tests with RG405 and LMR200 cable show that the length reported by the script comes remarkably close to the actual length.
Tomi Engdahl says:
NanoVNA YouTube playlist
https://www.youtube.com/playlist?list=PLu7u7NoPCLps5ZcDRKkdYAVdOPS2KlW4s
Tomi Engdahl says:
TDR with the NanoVNA
https://blog.nart.org/2020/01/19/tdr-with-the-nanovna/
It’s important to note that the current NanoVNA-Saver software doesn’t present TDR the way most people expect. It stacks the impedances of the various segments
What did I learn in the end? It looks like my various lengths of cable are fine. Most importantly I learned that UHF connectors have a surge impedance of around 35 ohms instead of the 50 ohms we are looking for. That causes reflections and increases the return loss of your feedline.
Tomi Engdahl says:
Upgrade NanoVNA use DFU
https://nanovna.com/?page_id=103
Tomi Engdahl says:
How to Verify S-parameter Causality
https://resources.altium.com/p/causality-transmission-lines?utm_source=marketo&utm_medium=email&utm_campaign=newsletter-202009&utm_content=brain-food&mkt_tok=eyJpIjoiT0RFM09ESTBNall3T1RRMCIsInQiOiJkMHdUZFdiZmNBS3RGNjhTV2FjTVFhMWdxeHI0RjFXVnBnc1VkangrU3lIeTRKb1wvd0tLQkFiTkkyQVN6RzBCSGZ2cmx4Tmt4NkhJSFBueGR1RmxJcXFIZjhxak5IYmNCRmpvMEpTbTI2QlVLamhpa2VGUURJUTN3ZWg0ZVZDVVcifQ%3D%3D
If you’re doing anything with S-parameters, you’ve run into causality problems. The first time hearing your S-parameters are non-causal is an uncomfortable experience. A customer may say, “your S-parameters fail my causality tool. Please fix them and send me new data. Thanks.” Thanks indeed. After getting that message, you probably went to your resident SI expert, Google, and typed in causality.
What is S-parameter Causality and How Do I Check for It?
Causality simply means an effect must happen after a cause. You hit a bell with a hammer, then the bell rings. It would be strange, if not unnerving if the bell rang as the hammer approached it. In systems described by S-parameters, a response must occur after a stimulus. There are three typical stimuli signal integrity engineers analyze: an impulse, a step, and a pulse.
The inverse Fourier transform of an S-parameter is a transfer function for a particular type of signal. For example, Kurokawa’s treatment of transmission line S-parameters defines the inputs and outputs in an N-port network in terms of equivalent power, and the S-parameters act like a transfer function for this particular type of signal. Most engineers are more familiar with a standard transfer function in terms of input and output voltage. Regardless of how you define a transfer function (as an S-parameter or filter), every transfer function has an impulse response function.
The first thing to do to check causality with minimal work is to take the inverse Fourier transform of an S-parameter and look for responses before the time of the stimulus (t = zero seconds). Before zero seconds, the system should be at rest, and any non-zero value indicates a causality violation.
Tomi Engdahl says:
Using the VNWA Testboard Kit
https://groups.io/g/nanovna-users/topic/34383654
nanoVNA-H – a ferrite cored test inductor impedance measurement – s21 series vs s11 reflection
https://owenduffy.net/blog/?p=16088
Tomi Engdahl says:
RF Demo Kit NanoVNA Radio Frequency Test Board Vector Network Filter
https://www.wish.com/product/rf-demo-kit-nanovna-radio-frequency-test-board-vector-network-filter-5e008c2288acf90ed7e0d36a?hide_login_modal=true&share=web
Tomi Engdahl says:
RF Demo Kit NanoVNA nanonva-f RF VNA test board filter attenuator
https://www.aliexpress.com/i/10000072693824.html?tt=API&gsaid=95774&_gs_cttl=3&af=95774&aff_platform=api-new-link-generate&sub_id=fi1&sk=_dVC2H1K&aff_trace_key=f64336fa1e5049ac8da32f27fe6a8e35-1600113033290-06865-_dVC2H1K&_gs_ref=29f27435b10336a5464d090c5118a0e2eafb3016&dp=29f27435b10336a5464d090c5118a0e2eafb3016&sub_id5=EAIaIQobChMIysKV0bTp6wIVmZSyCh2JHQBVEAMYAiAAEgKBIvD_BwE&terminal_id=7f9a33e37d8a4e109e18cdae21cae377
Tomi Engdahl says:
Comparing NanoVNA with the Keysight Fieldfox N9952A
https://nuclearrambo.com/wordpress/comparing-nanovna-with-the-keysight-fieldfox-n9952a/
Tomi Engdahl says:
Cable impedance profile with NanoVNA and TDR script
https://nuclearrambo.com/wordpress/cable-impedance-profile-with-nanovna-and-tdr-script/
Tomi Engdahl says:
Use NanoVNA-F’s TDR function to measure the physical length of the cable and RF Demo Kit experiment
https://www.youtube.com/watch?v=24QkBN-W9n4
This video tutorial demonstrates how to use NanoVNA-F’s TDR function to measure the physical length and electrical delay of a coaxial cable.
Tomi Engdahl says:
NanoVNA – TDR
https://zs1sci.com/blog/nanovna-tdr/
Accurately measuring cable length with NanoVN
https://nuclearrambo.com/wordpress/accurately-measuring-cable-length-with-nanovna/
Deriving Time response from Return loss
Remember that the VNA does its measurements in the frequency domain. The X-axis represents the frequency whereas the Y-axis represents the magnitude of return loss or insertion loss in dB.
If we transform the frequency domain data into the time domain, we should see the time domain nature of our measurement. In order to understand this, we need to understand the concept of return loss. Imagine, you have an open-ended coaxial cable connected to your radio transmitter. If you happen you transmit through this open cable, the entire signal is going to propagate to the end of the cable and reflect back towards your transmitter.
As we all know, VSWR of an open or short circuit cable is always very high. In terms of return loss, we are going to see 0dB on our charts. So, if return loss tells us about the reflected signal, it should also tell us some information about the source of reflection. The answer to this lies in the phase of the return signal. By using the magnitude and phase of the signal measured throughout the frequency sweep, we can compute the distance from where reflection occurred.
Tomi Engdahl says:
https://www.rudiswiki.de/wiki9/nanoVNA
Tomi Engdahl says:
NanoVNA To Test The Loss & Length Of Coax Cables by Jim W6LG YouTube Elmer for Ham Radio Basics
https://www.youtube.com/watch?v=R5iYuGLvlas
Tomi Engdahl says:
NanoVNA usable as spectrum analyzer?. Yes, if you know what you are doing
https://groups.io/g/nanovna-users/topic/34079496
NanoVNA usable as spectrum analyzer???
https://erikkaashoek.blogspot.com/2019/09/nanovna-usable-as-spectrum-analyzer.html
Tomi Engdahl says:
#520 NANOVNA used as a spectrum analyzer?
https://www.youtube.com/watch?v=xMQZTy3iV9o
WARNING: do not input more than 0dBm (1mW) power into the NANOVNA
Can the NANOVNA be used as a spectrum analyzer? The answer is complicated but probably not.
Tomi Engdahl says:
Spectral Analysis with a Vector Network Analyzer
https://coppermountaintech.com/spectral-analysis-with-a-vector-network-analyzer/
Tomi Engdahl says:
TDR with the NanoVNA
https://blog.nart.org/2020/01/19/tdr-with-the-nanovna/
how to use TDR in the firmware of the nanovna?
https://groups.io/g/nanovna-users/topic/34295118