This article talks about measuring 10 Mbit/s (10Base-T) and 100 Mbit/s (100Base-TX) twisted pair Ethernet signals. Those standards use two wire pairs for the communications and use differential signaling.
Differential signaling is a method for electrically transmitting information using two complementary signals. The technique sends the same electrical signal as a differential pair of signals, each in its own conductor. During a digital pulse, each wire in the pair carries a signal that is the same voltage, but opposite polarity. Differential signaling combined with twisted pair wiring has good noise-canceling capability.
The differential signaling presents soem challenges when measuring the signals with osciloscope. Oscilloscopes typically have single ended probes which has one signal wire and ground. If you are going to measure on a Twisted Pair connection, the chances are that none of the wires are “ground”, so connecting the probe ground to one of the wires *may* cause problem:It will probably do bad things to signal quality, though, thus affecting your readings.
For what regards the “ground” problem, you can use a differential probe or in alternative two probes (A and B) with grounds connected each other and display the difference between them (A-B), once you have connected A and B to the respective wires. Expect to see around ± 2.5V (over twisted pair) on 10BASE-T and three-level signal (1 Volt, 0 Volt, -1 Volt) for 100BASE-TX. NIC (Network Interface Card) that works at 10Base-T mode outputs data at “Manchester Code”, which is pretty easy to interpretate. You can find examples on decoding athttps://goo.gl/photos/3EQojfnYpNPd4fWz7. Trying to decode 100BASE-TX signal is much harder, so you propably need to invest to an expensive instrument with decoding software. This video demonstrates a real example of a Ethernet wire attached to a device with live data.
https://www.youtube.com/watch?v=C8B2puZARqQ
What are the cheap hacks to seem Ethernet signals on the oscilloscope screen without investing a lot of money? Are some tips:
I have used a passive Ethernet Tap circuit for successfully monitoring 10 Mbit/s and 100 Mbit/s Ethernet traffic. This circuit connects one Ethernet signal to two Ethernet cards that receive it (one the real communicating device and other the monitoring device). This circuit is a widely used hack. It is a hack in a sense that it is not technically up to the specifications an Ethernet device should need, but it is simple and works pretty well in most cases. The simple construction method used in this circuit creates impedance mismatches to the communications line, which are not good for the communications. But because Ethernet is pretty robust technology this “not so good” system works well enough at least with short cable runs on lab.
Then the next step is to replace that monitoring Ethernet card with some interface that connect the signal to oscilloscope. For this task I built this a simple Ethernet line to oscilloscope adapter circuit out of old Ethernet card.
First I picked an old ethernet card (old junk card works):
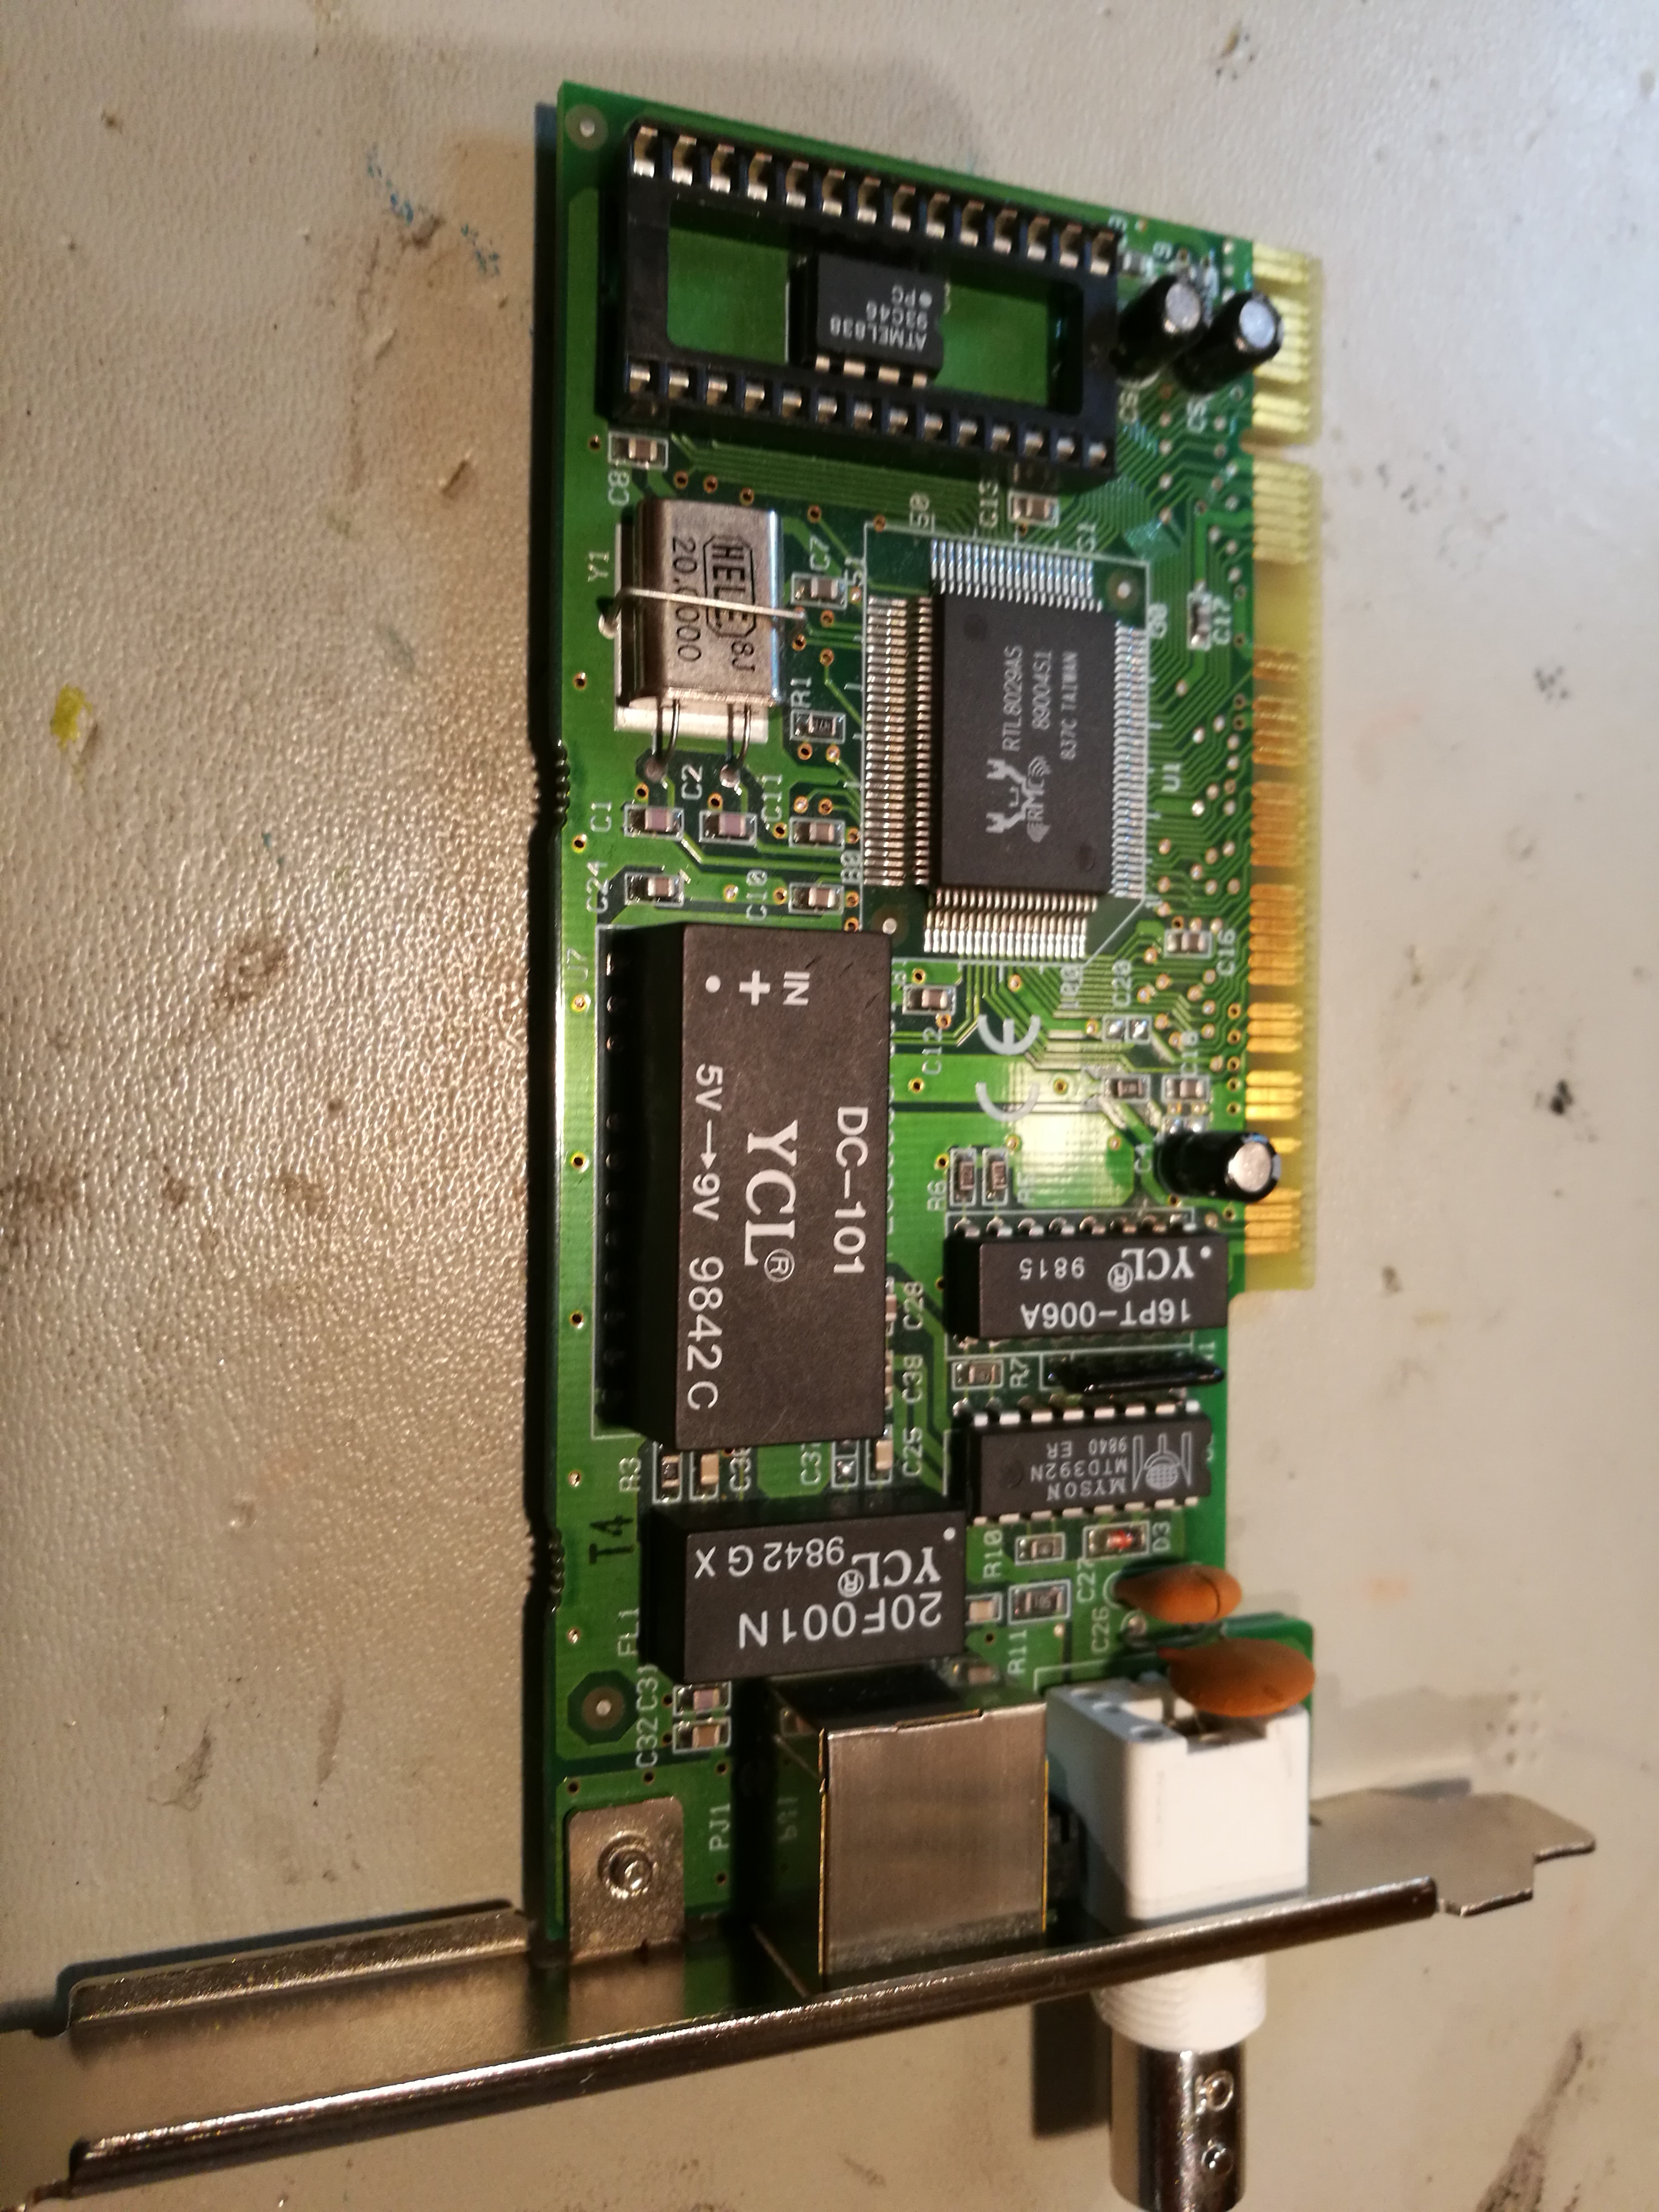
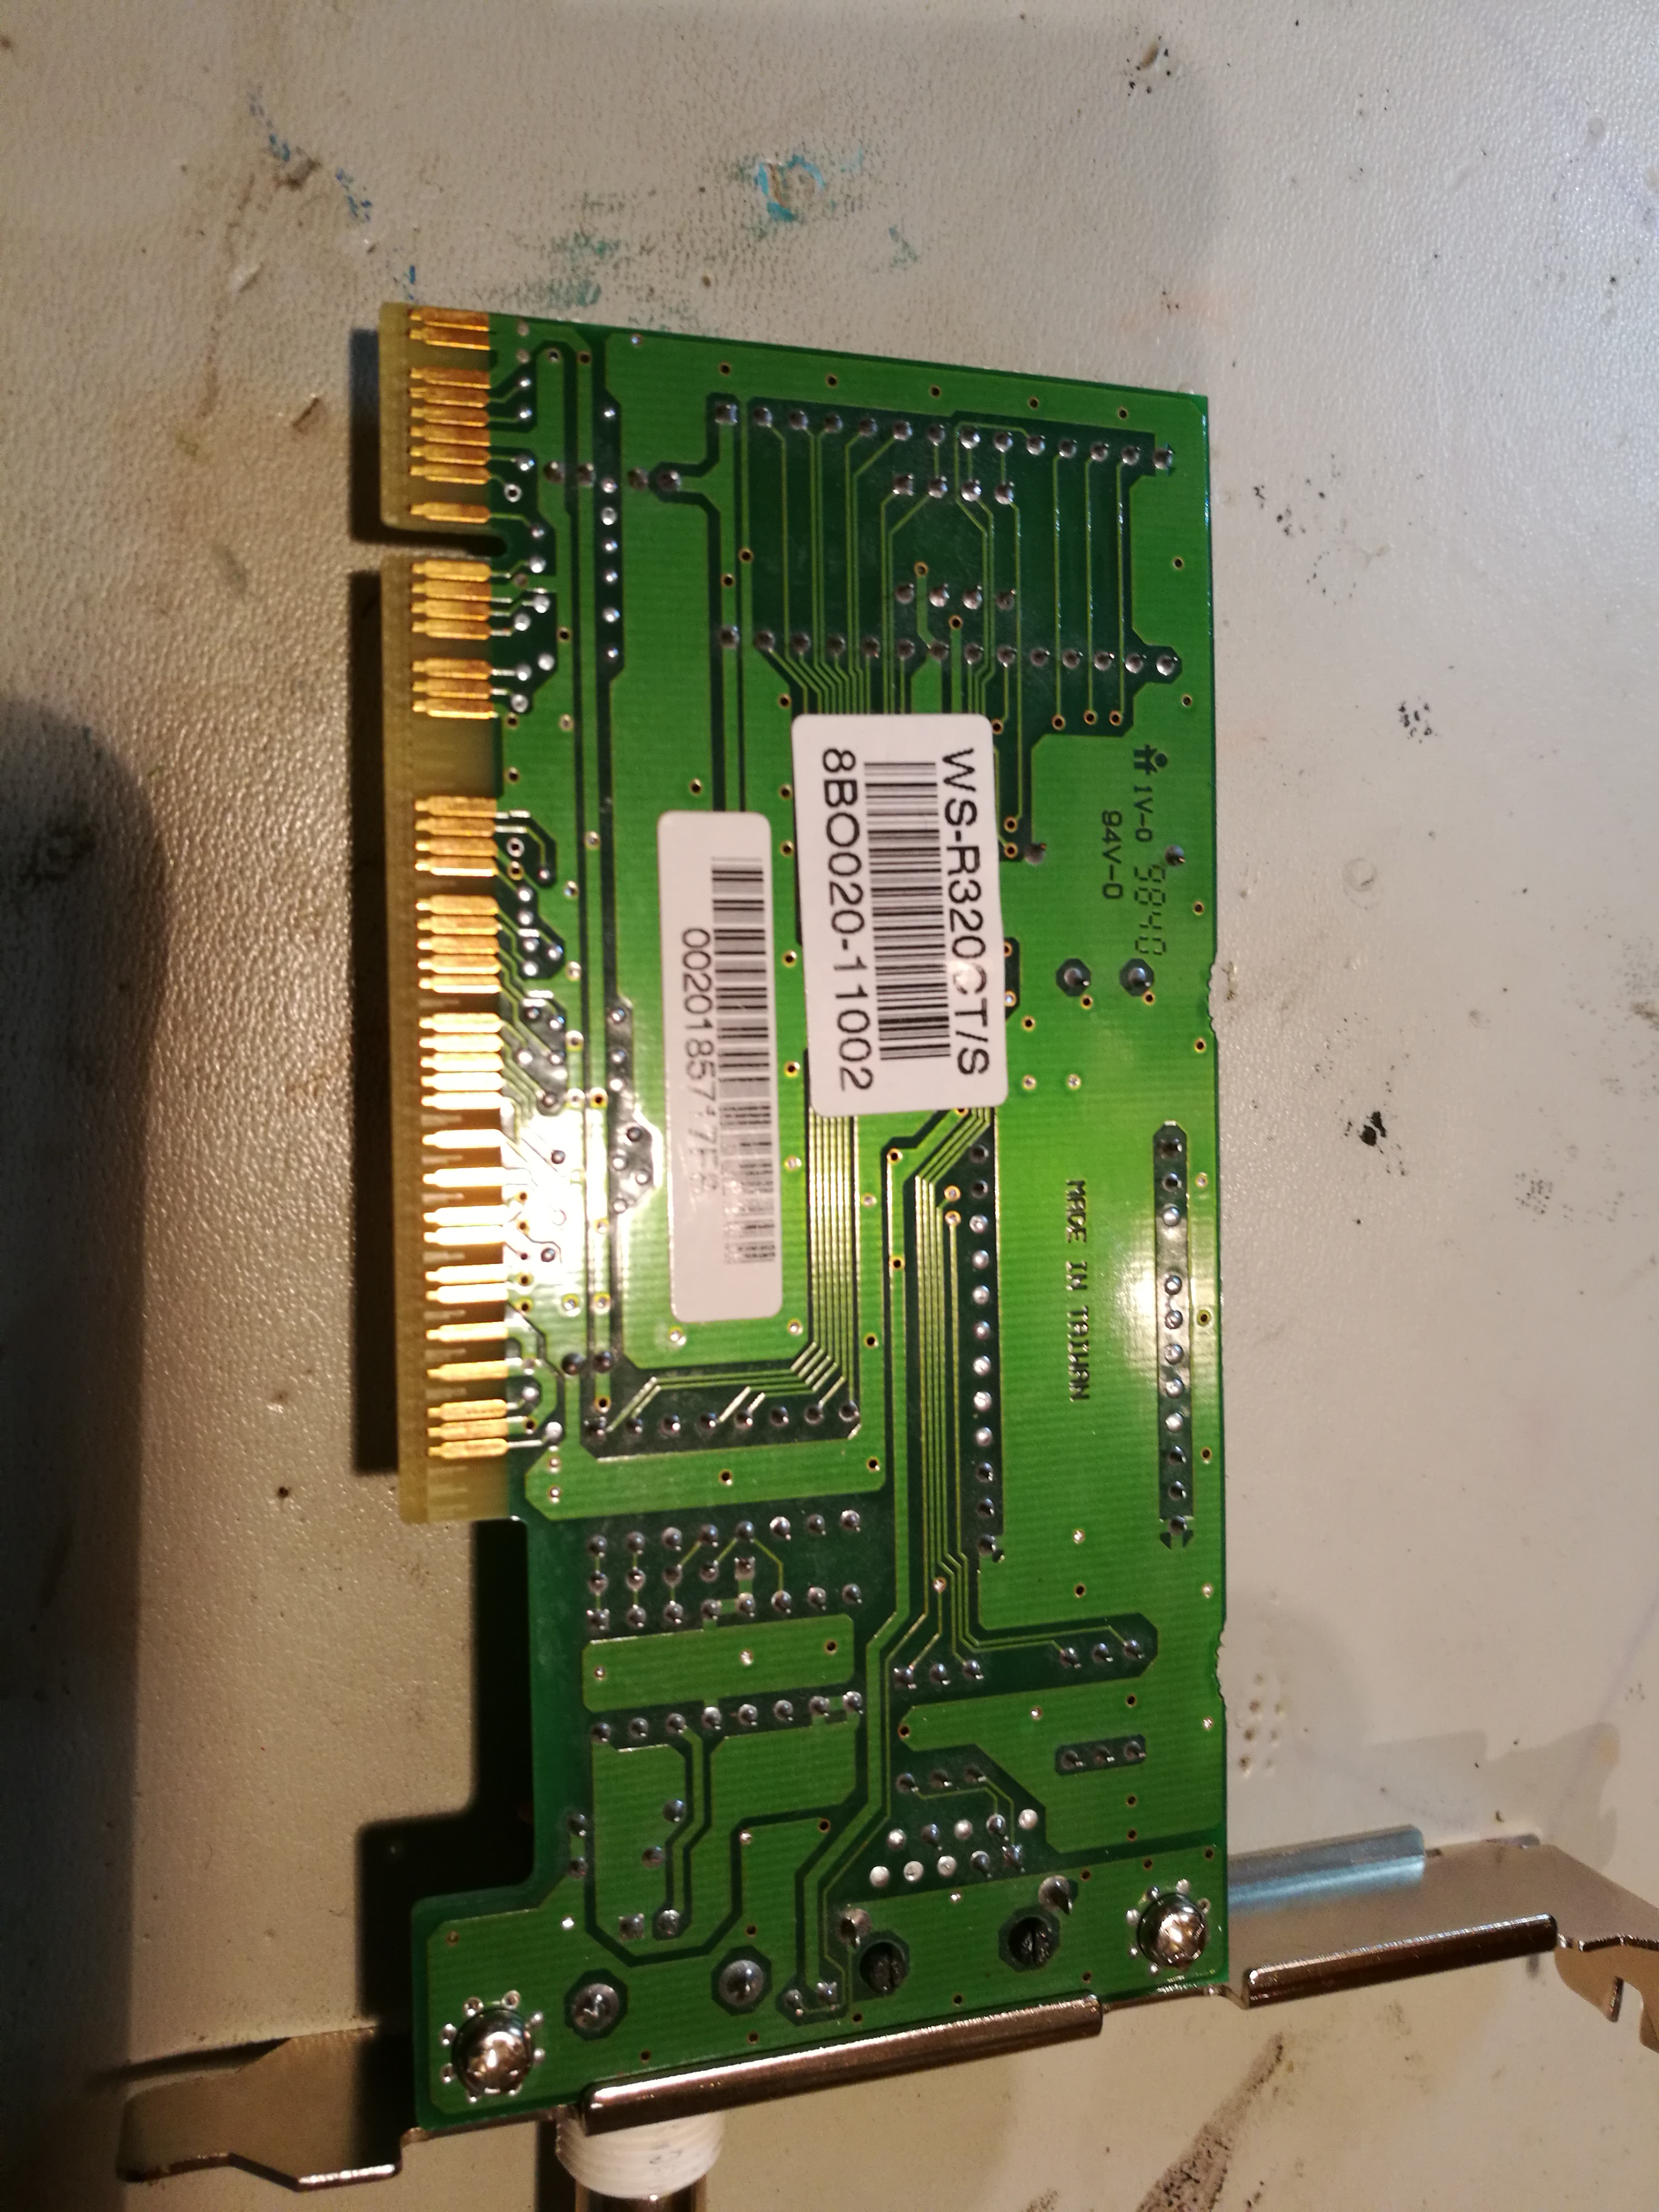
Here is solder side view of the card:
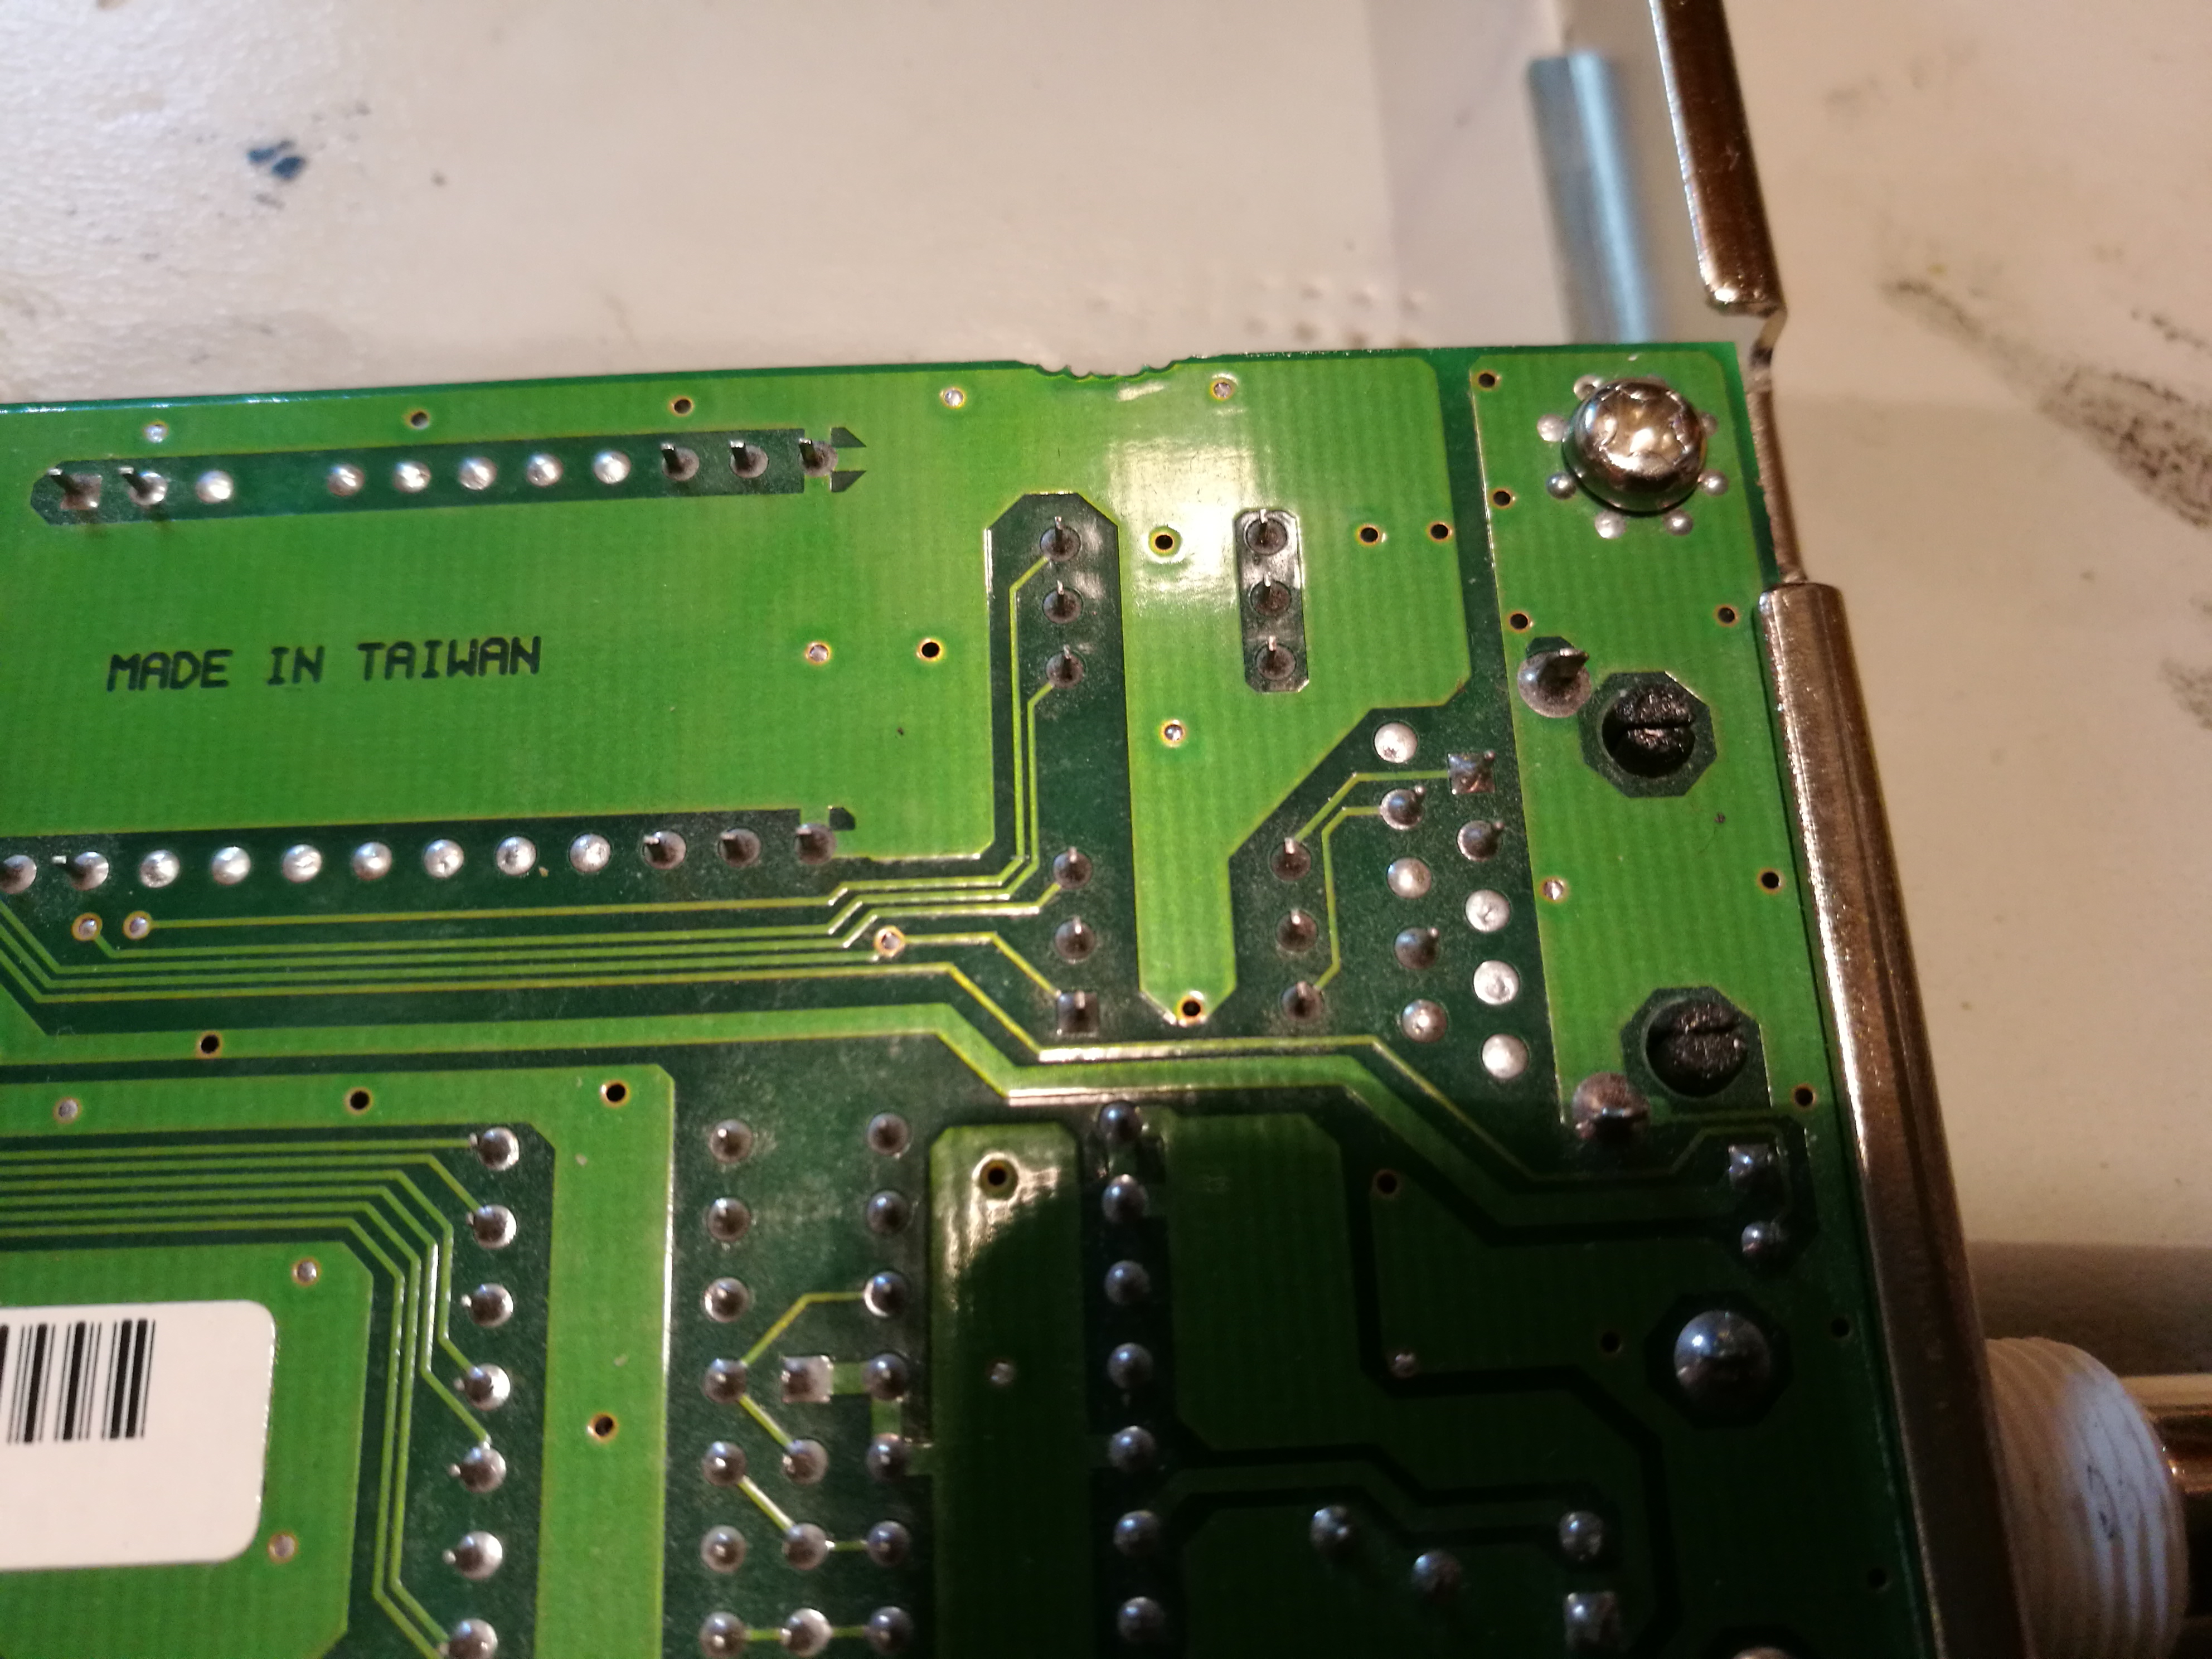
Next find the Ethenret line transformer (bottom right) pins and find out which side is secondary that connect to Ethernet chip instead of RJ-45 connector:
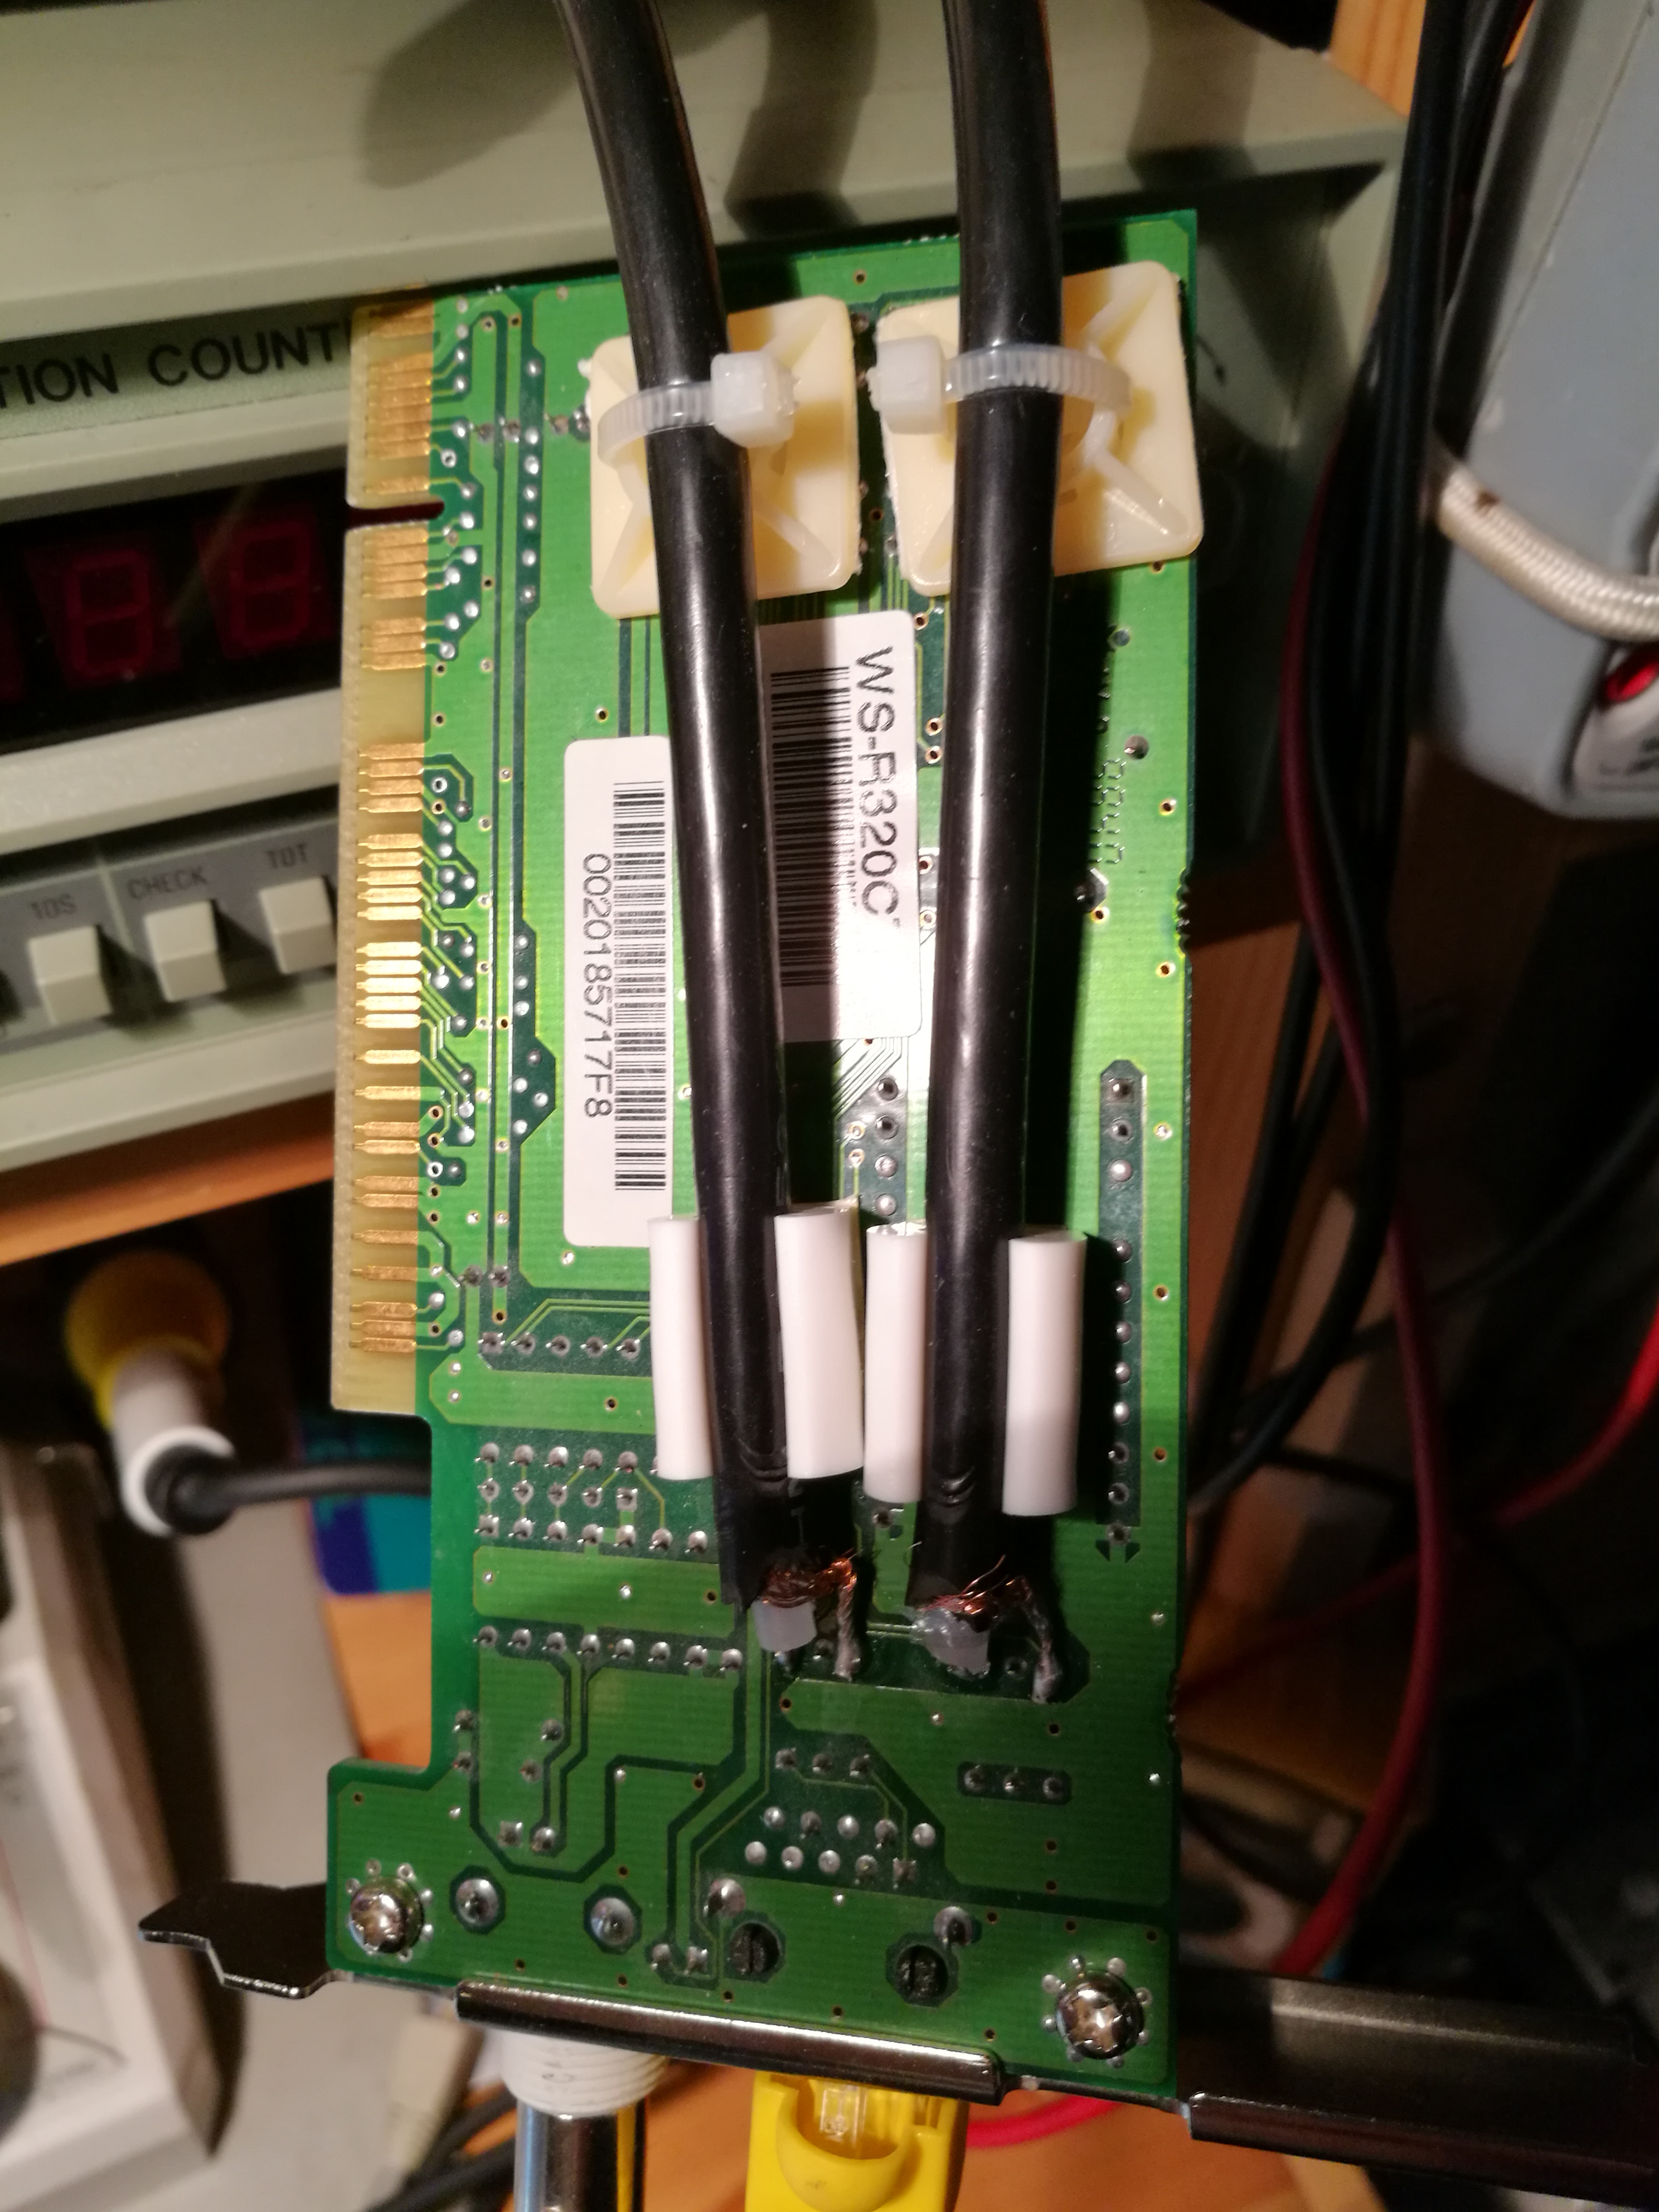
The needed modification is to solder a short coaxial cable (that goes to oscilloscope) to the TX and RX secondary pins:
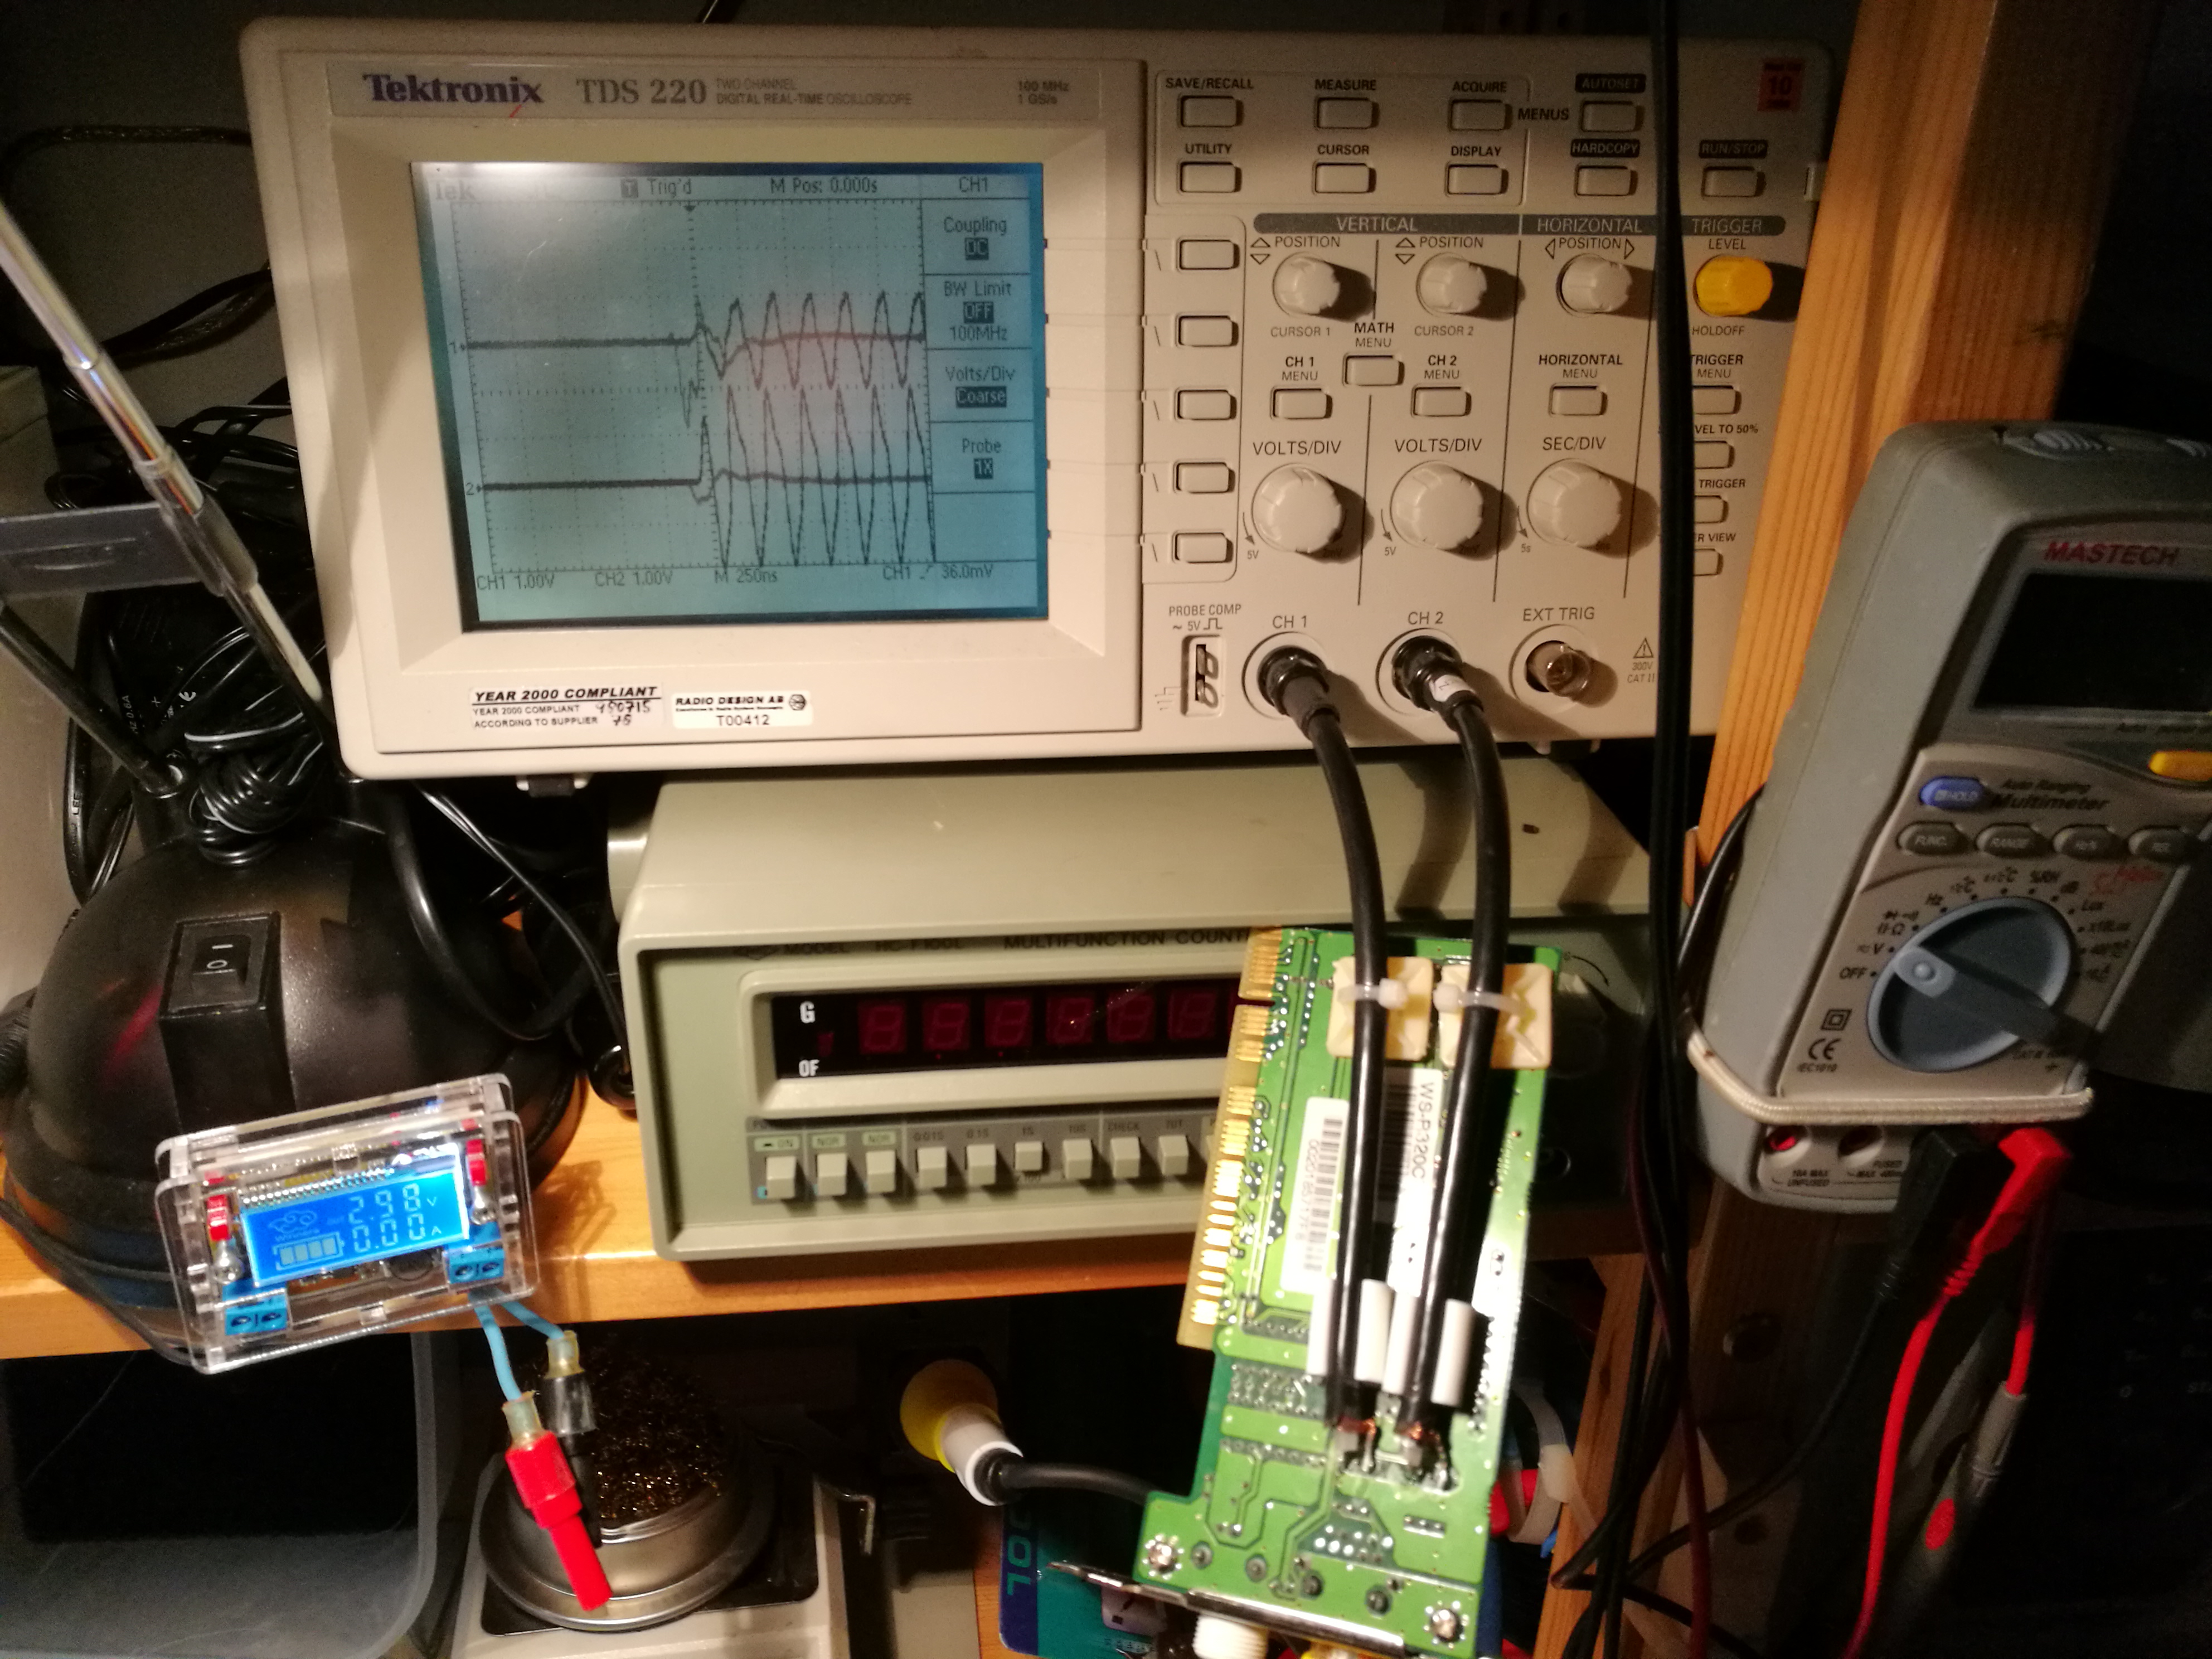
Here are the results on the oscilloscope screen:
3 Comments
Tomi Engdahl says:
Cheap ethernet decoding on a mixed-signal scope
https://www.youtube.com/watch?v=SYnO9CsTEqQ
Tomi Engdahl says:
Analyzing actual Ethernet encoding | Networking tutorial (4 of 13)
https://m.youtube.com/watch?v=i8CmibhvZ0c
In this video, we hook an oscilloscope up to an Ethernet link to see what’s going on.
Tomi Engdahl says:
What’s That Scope Trace Saying? UPD And Wireshark
https://hackaday.com/2022/08/14/whats-that-scope-trace-saying-upd-and-wireshark/
[Matt Keeter], like many of us, has a lot of network-connected devices and an oscilloscope. He decided he wanted to look into what was on the network. While most of us might reach for Wireshark, he started at the PCB level. In particular, he had — or, rather, had someone — solder an active differential probe soldered into an Ethernet switch. The scope attached is a Textronix, but it didn’t have the analyzer to read network data. However, he was able to capture 190+ MB of data and wrote a simple parser to analyze the network data pulled from the switch.
The point of probing is between a network switch and the PHY that expands one encoded channel into four physical connections using QSGMII (quad serial gigabit media-independent interface). As the name implies, this jams four SGMII channels onto one pair.
From Oscilloscope to Wireshark: A UDP Story
https://www.mattkeeter.com/blog/2022-08-11-udp/
Like many of you, I’ve got hardware on my desk that’s sending UDP packets, and the time has come to take a closer look at them.
Most “low-level” networking tutorials will bottom out somewhere at “use tcpdump to see raw packets”. We’ll be starting a bit lower in the stack; specifically, here
This is a high-speed active differential probe soldered to an Oxide Computer Company rack switch. We’re going all the way down to the metal.
The oscilloscope doesn’t have a built-in QSGMII analyzer (and we’ll want to do fairly sophisticated processing of the data), so I wanted to export waveform data to my computer.
How much data should I capture? Analog waveforms can easily add up to multiple gigabytes, so I’d like to capture a small amount while still catching a packet or two.
I knew that a device on the network was emitting about 30K UDP packets per second, or one packet every 33 µs. I configured the oscilloscope to collect 100M samples at 1 TSPS (tera-sample per second, 1012), which multiplies out to 100 µs of data; this means we should catch 1-3 UDP packets.
After hunting down a USB key, I ended up with a 191M .wfm file to process.
We know our sample rate (1 TPSP) and the nominal QSGMII bit rate (5 GHz); this means that a single-bit pulse (e.g. 010) should be a 200-sample pulse. In turn, we expect a comma character to be roughly 1000 samples long (200 × 5).
The oscilloscope and switch may not have exactly the same clock rate. If we go a long time between comma characters, we may end up sampling at the wrong position in the waveform!
It turns out that we need to synchronize in two places:
Comma characters tell us when a new code-group starts
Bit transitions help us keep the clock in sync
Storing and analyzing packets
Decoding ethernet frames with our eyes gets old fast.
Luckily, there are lots of good tools for working with frame data. Using the pcap library, we can write out a .pcap file to be analyzed with Wireshark.
Here’s our full analyzer, going from .wfm to four .pcap files
The whole pipeline – from loading the .wfm to writing the .pcap file – runs in about 410 milliseconds on my computer. Considering I put no effort into optimization, this isn’t too bad!
Using tshark, we can confirm that these are UDP packets: