Coaxial cables are essential transmission lines in many RF/microwave applications. Coaxial cables are usually reliable, but sometimes coaxial cables can develop unseen faults that may be anywhere in their length. Finding those faults can often be challenging, typically requiring the use of time-domain reflectometry (TDR) which operates much like a radar system.
![]()
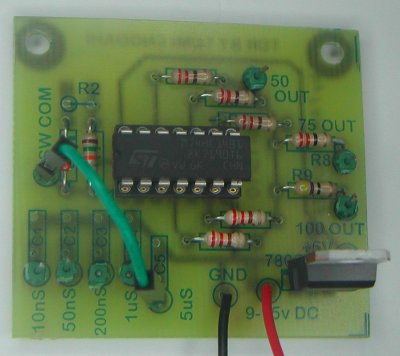
Analysis of the reflected signal gives insight into the location and type of fault. The resolution of a distance measurement depends on the risetime of the pulsed test signal. There are commercially available TDR devices. For some less demanding applications a normal oscilloscope with cheap TDR pulse generator will do. For example my easy to build Time Domain Reflectometer (TDR) circuit has been available as kit made by Far Circuits.
Microwaves&RF magazine article Method Finds Faults in Coaxial Cables that I just read presents a straightforward technique that works in the frequency domain without need of exotic test equipment to accurately find the distance to a fault in RF/microwave coaxial cables. The (FD)2 method does not require specialized test equipment or very high test frequencies to determine the location of a cable fault. In this approach the pulse generator can be replaced by an RF signal generator and the scope by an RF voltmeter. (FD)2 method provides a simple means to find the distance to a gross fault, such as an open or short, in a transmission line using only a relatively low-frequency signal generator and some form of amplitude measuring instrument.
At particular frequencies and line lengths, the reflected signal wave will be completely out of phase with the initial forward-wave signal, resulting in cancellation of the signal wave. With the (FD)2 approach, the longer the distance to the fault, the lower the frequency required to find it.
The (FD)2 method for finding faults in coaxial cables can be simplified when performed with a spectrum analyzer and a tracking generator (no hand tuning or generator and and continuously reading meter readings as you see the results as picture on screen):

For more details read Method Finds Faults in Coaxial Cables article.
25 Comments
Tomi Engdahl says:
Arcom Builds upon the Success of Quiver with New Innovations
http://www.btreport.net/articles/2016/07/arcom-builds-upon-the-success-of-quiver-with-new-innovations.html?eid=296443424&bid=1489951
Cable impairment detection luminary Arcom has added to their Quiver line of field fault location tools. Now, in addition to exclusive CPD detection and Xcor technology, Quiver is equipped with Network Traffic Compatible Time Domain Reflectometer technology (NTC TDR), which allows the Quiver full functioning capability on an active network – there is no longer any reason to shut down service and frustrate your customers during troubleshooting.
Hunter’s innovative radar technology identifies the source of Common Path Distortion (CPD), way before your network is affected.
https://www.arcomdigital.com/quiver/
Identifying the causes of network impairments and being able to pinpoint their locations are key to eliminating them. Quiver® is the only field-troubleshooting tool that can do just that. The unique power of Quiver comes from our patented Xcor® technology, which uses advanced passive radar signal correlation to measure the presence of CPD and any other nonlinear distortion. Quiver allows technicians to consistently detect well below the system noise floor, revealing impairments previously invisible or intermittent. Quiver boosts your productivity by determining the precise distance to a problem source, eliminating hours of guesswork. Most importantly (especially to your customers) your technicians can identify and locate issues without ever disturbing your network.
We’ve seen it time and time again – once a technician demos a Quiver, they don’t want to give it up. On top of Xcor, we’ve added a lightning-fast FFT, forward and return spectrum analyzer, and our latest innovation, an optional NTC TDR, that works as a PNM companion tool. It’s the first TDR able to operate accurately on a live plant without network disruption – truly a game changer in network maintenance.
Tomi Engdahl says:
Page http://hackaday.com/2016/11/08/crossing-wheatstone-bridges/ has one interesting fault locating technique:
Finding Faults Underground – Murray Loop Test
The Murray loop test is a method of using a Wheatstone bridge to find the location of a fault in underground wiring without having to dig first.
The faulty cable is the one that’s underground with a ground fault at some unknown location along its length.
With this used for a Wheatstone bridge, we first have to balance the bridge, meaning that the current through the galvanometer has to be made zero.
once it’s balanced, we know R1, R2 and L and we can solve for Lx. Knowing the length Lx, we know where to dig to repair the fault
Tomi Engdahl says:
Simple trick to measure plane impedance with a VNA
http://www.edn.com/design/designcon/4435822/Simple-trick-to-measure-plane-impedance-with-a-VNA?_mc=NL_EDN_EDT_pcbdesigncenter_20161212&cid=NL_EDN_EDT_pcbdesigncenter_20161212&elqTrackId=8e9bbce2176a49cfa3c802ffdea1fed2&elq=0d6c11ce0fdd48e39f26ee54d054c299&elqaid=35129&elqat=1&elqCampaignId=30689
The question of time vs. frequency, as the most useful measurement domain, has long been a controversial topic. In some cases, it leads to rather heated discussions. The argument in favor of a vector network analyzer (VNA), a frequency domain instrument, is that the dynamic range and signal to noise ratio (SNR) of a VNA are much better than they are for a time domain reflectometer (TDR). The argument in favor of TDR measurements is that they tend to be lower cost and are taken from a direct reading, so there is little to interpret. Fortunately, most new TDRs can also transform measurements to S-parameters (much like a VNA) and most new VNAs can also transform to time (providing TDR equivalent data).
Having said all of this, the measurement of a PCB plane using a VNA may not be as straightforward as you might expect. One simple trick makes it easy.
The general method of determining the characteristic impedance of the plane is to measure the open circuit capacitance and the short circuit inductance.
Rather than calculating the inductance and the capacitance, which takes time and effort, there is an easier way. Since the capacitive impedance is falling at 6dB/octave and the short circuit inductance is increasing at 6dB/octave, we can average the short circuit and open circuit impedance at any frequency.
The TDR and VNA characteristic impedance measurements are almost 20% apart, which can result in degraded signal and/or power integrity.
The simulation results, shown in Figure 4, clearly show the frequency shift and impedance shift resulting from the 1nH shorting inductance. Without knowing the precise inductance of the short circuit, it is difficult to determine the exact answer.
This is where we employ the trick and make the measurement both easier and more accurate.
In conclusion, measuring the impedance from a short and open plane can have a significant error due to the inductance of the short. Rather than making the measurement more complicated by attempting to include the short inductance, the measurement is simplified using a single open sweep. The simplified measurement has been shown to be within 1% of the exact answer. This small error is likely due to the accuracy at which the cursors can be placed.
Tomi Engdahl says:
System models help correlate measurements to simulations
http://www.edn.com/design/test-and-measurement/4443309/System-models-help-correlate-measurements-to-simulations
Do you use an oscilloscope to verify the operation of your design or do you simply trust your simulation? Being a conscientious engineer, you probably probe your DUT and view the waveform data on an oscilloscope. You also believe that you have an accurate device or component level schematic model, perhaps a SPICE model. You simulate the behavior at your test point (TP) in your model, and the results don’t exactly match what is shown on the oscilloscope. Is your model correct or is the measurement system, including probes and oscilloscope, at least partly to blame?
You may also notice that your circuit behavior changes when you probe the TP. In some cases, it gets worse or in others it gets better. Regardless, the simulation and measurements aren’t aligning and you’re stuck. How can you explain—or better yet simulate—why this is happening?
Tomi Engdahl says:
What’s in Your Coaxial Cable?
Coaxial cables are a standby of the RF/microwave industries, as they connect vital components ranging from smartphones and laptops for everyday life to radar and GPS for military and aerospace.
http://www.mwrf.com/passive-components/what-s-your-coaxial-cable?code=UM_Classics06117&utm_rid=CPG05000002750211&utm_campaign=11700&utm_medium=email&elq2=2c3b139545724970830b5e1e51a423ee
Tomi Engdahl says:
Quiver S and XT have added in the world’s first Network Traffic Compatible TDR. Now technicians can pinpoint micro-reflections and use the TDR without interrupting customer services and taking the network down.
AN INTRODUCTION TO A NEW MICRO-REFLECTION LOCATION TECHNOLOGY
https://www.arcomdigital.com/ntc-tdr-white-paper.html
CLEARLY BETTER.
2
This paper describes a new technology that for the first
time allows the technician to precisely measure the
distance to impedance mismatches in the HFC network
without affecting any active network traffic.
OVERVIEW
AN INTRODUCTION TO AN ENTIRELY
NEW TYPE OF NETWORK TRAFFIC
COMPATIBLE TIME DOMAIN
REFLECTOMETER – THAT CAN BE
USED ON ACTIVE PLANT WITHOUT
ANY SIGNAL DISRUPTION
The proactive network maintenance (PNM) initiatives being deployed
throughout the industry to identify sources of micro-reflections have
proven to be a game changer in how the HFC network is maintained.
The ability to direct a technician to a specific location in the plant to
start the troubleshooting process provides the opportunity for significant
operational savings and improved problem resolution times.
To address this issue, and to provide the technician with companion
PNM field troubleshooting tools, Arcom Digital has developed a new
and innovative Network Traffic Compatible (NTC) Time Domain
Reflectometer (TDR). NTC TDR enables the technician to easily and
accurately measure the distance to the source of the micro-reflection
problem – and it allows them to work with the confidence that the
identified device or cable being fixed or replaced is the exact source
of the problem.
This new test equipment is termed NTC TDR because it is able to
operate on an active plant without disrupting or being disrupted by
any of the traffic or transmitted data. Traditional TDRs employed in
the industry are very inaccurate in the presence of AC power, so they
require the technician to disconnect the network in order to use.
The NTC
TDR calculation of the time distance and corresponding physical
distance to the impedance mismatch is based on an autocorrelation
process which utilizes very low level non-intrusive spread spectrum
signals transmitted in the return path in the forward
Unlike other TDRs, the NTC TDR is a two-port device.
It is obviously important that the NTC TDR does
not in any way disrupt return signal quality.
From the DOCSIS specification, in order not
to affect signal quality any signal needs to be
at least -25dBc relative to the return QAMs so
as not to impair CNR/SNR. As such, allowable
transmit levels are extremely low level and
range from and are limited to -10dBmV to
+10dBmV (typically -30dBc to -50dBc) –
ensuring that the spread spectrum signal will
not be network affecting. A built-in spectrum
analyzer provides a simple one button means of
confirmation
As an alternative connection methodology, the NTC TDR can be
connected directly to a line passive where the forward and return
connection is made by using a -20dB 2-port test probe
As described, the NTC TDR operates utilizing very small signal
levels. The -30dBc signals are further attenuated through test port
loss, cable loss, and device insertion loss for both the transmitted and
reflected signal. These very low level signals would be masked and
obliterated by high-level active return traffic. As such, the internal
spectrum analyzer is used as shown in Figure 3 as a gating tool to
ensure autocorrelation signal samples are only accumulated during the
quiet periods when QAM signals are not present.
With the 5-42 MHz return,
resolution of approximately 10 feet
and accuracy of 1 foot is achieved.
For 65 MHz returns in Europe and
possibly in the future in the United
States, resolution and accuracy will
be improved twofold.
The NTC TDR provides the technician with visibility to all linear
distortions and provides the ability to test a leg unobtrusively prior
to making a repair or changing out equipment.
Tomi Engdahl says:
Calibrate scope jitter using a transmission-line loop
https://www.edn.com/design/test-and-measurement/4337877/Calibrate-scope-jitter-using-a-transmission-line-loop
Digital-clock-period jitter is the variation in the period of a clock cycle compared with a nominal (average of many cycles) clock period. To accurately measure period jitter using an oscilloscope, you must subtract the oscilloscope jitter from the measured jitter. However, oscilloscopes rarely have a jitter specification, so you must determine the oscilloscope jitter. One method of measuring oscilloscope jitter is to use the oscilloscope to measure the jitter of a pulse generator with known jitter.
A transmission-line delay loop creates a delayed pulse at the oscilloscope.
Two 50Ω coaxial transmission lines implement the circuit and connect to the oscilloscope using two BNC T adapters. The line from the 50Ω generator to the 50Ω oscilloscope can be of any length. The length of the delay-loop line determines the delay between the first pulse and the delayed pulse. You set the generator’s pulse period to approximately five times the loop delay and the generator’s pulse duration to approximately one-half the loop delay.
The 50Ω oscilloscope, in parallel with the 50Ω line to the generator, forms a 25Ω load that matches the 25Ω pulse source impedance.
Tomi Engdahl says:
#143: Transmission Line Terminations for Digital and RF signals – Intro/Tutorial
https://www.youtube.com/watch?v=g_jxh0Qe_FY
An introduction to why and when terminations are needed for transmission lines in both high speed digital applications and RF applications. 50 ohm termination examples are given, but the principles apply for other line impedances as well. The basic operating principles of signal propagation down a transmission line and the effects of reflections coming from improperly terminated are covered. Examples for digital-like signals as well as RF signals are given.
Tomi Engdahl says:
Reflected waves on a cable
https://www.youtube.com/watch?v=zrDxSM91Jcg
Showing how a square wave signal is distorted by reflections from the unterminated end of a cable. Also shows proper terminating resistance and its effect
Transmission Lines – Signal Transmission and Reflection
https://www.youtube.com/watch?v=ozeYaikI11g
Visualization of the voltages and currents for electrical signals along a transmission line.
Tomi Engdahl says:
Impedance Matching 101
https://www.youtube.com/watch?v=QLUrwoHRLJM
Impedance Matching 101 presentation by Ward Silver, N0AX at Pacificon 2012. A great introduction on methodology and techniques to achieve optimum energy transfer between a electronic circuit source and load. Knowing these fundamentals allows for best system performance. More of Mr. Silver’s work is found monthly in the ARRL QST publication, “Hands-On Radio” column.
Tomi Engdahl says:
Cable Basics; Transmission, Reflection, Impedance Matching, TDR
https://www.youtube.com/watch?v=kOy0afN6lTs
Instruments such as the Analog Arts ST985 (www.analogarts.com), based on the TDR and wave transmission concept, characterize the length, impedance, and other characteristics of a cable.
When a signal travels through a cable, it is undisturbed until it encounters an impedance change, and if it encounters an open circuit, all of the wave reflects back to the source.
The characteristic impedance of the cable and the load impedance, determine what happens to the signal at the load.
Tomi Engdahl says:
Time Domain Reflectomety
https://www.youtube.com/watch?v=sqTR7FMaD68
Covers how to perform the function of a TDR by using an oscilloscope
and a pulse generator. Understanding the material in this video will
help you to understand how an actual TDR works.
Tomi Engdahl says:
Cable Fault Locating Techniques
https://www.youtube.com/watch?v=TbINuWvL5cQ
Even with the proper equipment and experience, cable fault locating can present challenges. These challenges are minimized significantly by understanding the equipment and techniques available and perhaps most important adhering to a disciplined step-by-step procedure.
Cable Basics; Transmission, Reflection, Impedance Matching, TDR
https://www.youtube.com/watch?v=kOy0afN6lTs
Tomi Engdahl says:
Fast Video Covers Coax Velocity Factor
https://hackaday.com/2019/10/11/fast-video-covers-coax-velocity-factor/
Measuring Coax at (nearly) the Speed of Light – Ham Radio Q&A
https://www.youtube.com/watch?v=SCF15sDD2IM
Tomi Engdahl says:
Testing The Speed-of-Light Conspiracy
https://hackaday.com/2016/09/29/testing-the-speed-of-light-conspiracy/
http://www.jensign.com/sol/index.html
Tomi Engdahl says:
With OTDR you can do TDR measurements on optical fiber installations:
Reading an OTDR Trace
https://www.youtube.com/watch?v=4jz7d_IvhF8
How to identify the symbols on a trace from an optical time domain reflectometer.
OTDR basics, Block Diagram, Operation, Display, Fault Location, Dead Zone & Attenuation Measurnment
https://www.youtube.com/watch?v=JiujKbgtdAY
Tomi Engdahl says:
Cable impedance profile with NanoVNA and TDR script
https://nuclearrambo.com/wordpress/cable-impedance-profile-with-nanovna-and-tdr-script/
Tomi Engdahl says:
Types of Coax Cable and Line Loss Calculator
https://www.qsl.net/co8tw/Coax_Calculator.htm
Tomi Engdahl says:
https://hackaday.com/2016/02/21/retrotechtacular-transmission-lines/
Tomi Engdahl says:
How Wrong Is VERITASIUM? A Lamp and Power Line Story
https://www.youtube.com/watch?v=iph500cPK28
0:00 Veritasium’s question and answer, was he right?
3:51 Short review of Derek’s video
5:24 Poynting Vector, direction of power flow
9:05 Detailed analysis of Derek’s question, Transmission Lines
17:37 WATCH THIS PART!
Tomi Engdahl says:
http://www.eriele.fi/kaapelitutka.html
Tomi Engdahl says:
Nykyisin kierrettäviä F-liittimiä ei saa käyttää, ks. https://www.finlex.fi/data/normit/48858/M_65_E2022_M.pdf
Tomi Engdahl says:
https://hackaday.com/2024/04/19/measuring-an-unknown-velocity-factor/
Tomi Engdahl says:
https://www.perel.fi/tuotteet/155083487/tdr-mittaus
Tomi Engdahl says:
https://www.wacs.ch/en/koaxialkabel
Not all coaxial cables are the same. There are many different applications to transmit signals without interference. Our range includes coaxial cables in the ohm range of 50 / 78 / 93 / 95 / 100 / 124 / 150 Ohm.
In addition to the standard coaxial cable, there is also the micro coaxial cable, which stands out from the crowd
with its ultra small diameter.